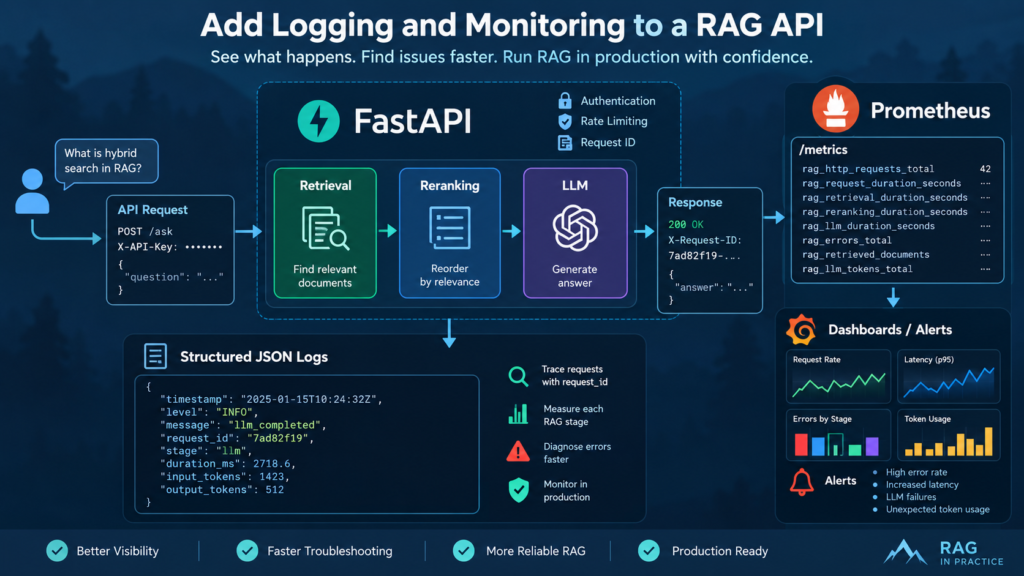
What You Will Build
In this tutorial, you will add logging and monitoring to a RAG API built with FastAPI. We will extend the production RAG assistant from the previous tutorials instead of creating a new application from scratch.
Our API already includes hybrid retrieval with BM25 and FAISS, metadata filtering, reranking, LLM generation, API key authentication, and rate limiting. Now we need visibility into what happens after the service is deployed.
We will add two complementary observability layers:
- Structured logs for tracing individual requests and diagnosing failures.
- Prometheus metrics for monitoring performance and behavior across many requests.
The final monitoring flow will look like this:
Client
   │
   ▼
FastAPI /ask
   │
   ├── Request ID
   │
   ▼
Authentication + Rate Limiting
   │
   ▼
RAG Pipeline
   │
   ├── Retrieval
   ├── Reranking
   └── LLM
   │
   ▼
Response
   │
   ├────────► Structured Logs
   │
   └────────► Prometheus Metrics
For every RAG request, we will be able to track useful operational signals such as:
- HTTP status code and total request latency;
- a unique request ID for log correlation;
- retrieval, reranking, and LLM latency;
- the number of documents retrieved and added to the LLM context;
- RAG pipeline errors and the stage where they occurred;
- LLM token usage when the provider returns usage data;
- authentication, validation, and rate-limit responses.
We will expose the aggregated measurements through a /metrics endpoint so that Prometheus can collect them.
RAG API
   │
   ├── JSON Logs
   │
   └── /metrics
          │
          ▼
      Prometheus
          │
          ▼
   Monitoring / Alerts
The goal is not to log every internal variable. Instead, we will collect enough information to answer practical production questions: Is the API healthy? Which RAG stage is slow? Where are errors occurring? Has retrieval behavior changed? Is LLM usage increasing?
By the end of the tutorial, the RAG assistant will have a compact observability layer that can be used locally, inside Docker, and as the foundation for production monitoring.
Prerequisites
This tutorial continues the RAG assistant developed in the previous parts of the series. Before you add logging and monitoring to a RAG API, you should already have a working FastAPI application with a protected /ask endpoint.
The existing RAG pipeline should contain the main stages we want to observe:
Question
   │
   ▼
Metadata Filtering
   │
   ▼
BM25 + FAISS Retrieval
   │
   ▼
Reranking
   │
   ▼
Context
   │
   ▼
LLM
   │
   ▼
Answer
The API from the previous tutorials also includes API key authentication and rate limiting. A simplified version of the current endpoint looks like this:
from fastapi import (
    Depends,
    FastAPI,
    Request
)

app = FastAPI()


@app.get("/health")
def health():
    return {"status": "ok"}


@app.post(
    "/ask",
    dependencies=[
        Depends(verify_api_key)
    ]
)
@limiter.limit(RAG_RATE_LIMIT)
async def ask(
    request: Request,
    body: AskRequest
):
    answer = ask_rag(
        body.question
    )

    return {
        "answer": answer
    }
Your exact implementation may differ. That is fine. The important requirement is that the retrieval, reranking, and generation stages can be measured separately.
Install the Monitoring Dependency
We will use Python’s built-in logging module for structured logs, so no additional logging package is required. For metrics, install the Prometheus Python client:
pip install prometheus-clientAdd it to requirements.txt as well:
fastapi
uvicorn
slowapi
prometheus-client
openai
sentence-transformers
faiss-cpu
rank-bm25
numpy
If the application runs in Docker, rebuild the image after updating the dependencies:
docker build \
  -t rag-assistant:1.3.0 .
Create an Observability Module
To keep monitoring code separate from the API and RAG logic, create a new file:
rag-assistant/
│
├── app.py
├── rag.py
├── observability.py
├── requirements.txt
├── Dockerfile
├── .dockerignore
└── data/
We will use observability.py for the logging configuration and Prometheus metric definitions. The API middleware will remain in app.py, while measurements specific to retrieval, reranking, and generation will stay close to the corresponding code in rag.py.
For latency measurements, we will use time.perf_counter(). It is appropriate for measuring elapsed execution time and lets us instrument the RAG pipeline without changing its behavior.
With the existing API and dependencies ready, we can start with structured logging and create a consistent format for the events generated by the RAG service.
Step 1 — Add Structured Logging to FastAPI
The first step to add logging and monitoring to a RAG API is to replace unstructured console messages with consistent JSON logs. Structured logging makes it much easier to search requests, filter errors, and analyze RAG API behavior after deployment.
Instead of producing messages such as:
RAG request completed in 3.2 secondswe want the FastAPI application to produce structured events:
{
    "timestamp": "2026-09-12T15:21:08+00:00",
    "level": "INFO",
    "message": "rag_request_completed",
    "status_code": 200,
    "duration_ms": 3214
}
Each field can later be searched or aggregated independently. This becomes especially useful when the RAG API processes thousands of requests.
Create a JSON Log Formatter
Open observability.py and add:
import json
import logging
import os

from datetime import (
    datetime,
    timezone
)


class JsonFormatter(
    logging.Formatter
):
    def format(self, record):

        log_record = {
            "timestamp": datetime.now(
                timezone.utc
            ).isoformat(),
            "level": record.levelname,
            "message":
                record.getMessage()
        }

        fields = [
            "request_id",
            "endpoint",
            "status_code",
            "stage",
            "duration_ms",
            "documents_retrieved",
            "documents_in_context",
            "error_type"
        ]

        for field in fields:
            value = getattr(
                record,
                field,
                None
            )

            if value is not None:
                log_record[field] = value

        return json.dumps(
            log_record
        )
The formatter creates a basic log record and then adds optional fields when they are available. This allows the same logger to handle HTTP requests, retrieval events, LLM operations, and errors without requiring a different logging format for every RAG stage.
Configure the RAG API Logger
Next, create a logger that writes JSON events to standard output:
def configure_logging():

    logger = logging.getLogger(
        "rag_api"
    )

    log_level = os.getenv(
        "LOG_LEVEL",
        "INFO"
    ).upper()

    logger.setLevel(
        getattr(
            logging,
            log_level,
            logging.INFO
        )
    )

    if not logger.handlers:

        handler = (
            logging.StreamHandler()
        )

        handler.setFormatter(
            JsonFormatter()
        )

        logger.addHandler(
            handler
        )

    logger.propagate = False

    return logger


logger = configure_logging()
The LOG_LEVEL environment variable lets us change logging verbosity without modifying the application:
LOG_LEVEL=INFOFor local debugging, it can temporarily be changed to:
LOG_LEVEL=DEBUGIn production, INFO is usually a better default because excessive debug output can generate large log volumes.
Write Structured RAG Events
Import the logger wherever RAG API logging is required:
from observability import loggerA normal API event can now include additional structured fields:
logger.info(
    "rag_request_completed",
    extra={
        "endpoint": "/ask",
        "status_code": 200,
        "duration_ms": 3184
    }
)
The formatter converts it into JSON:
{
    "timestamp":
        "2026-09-12T15:24:16+00:00",
    "level": "INFO",
    "message":
        "rag_request_completed",
    "endpoint": "/ask",
    "status_code": 200,
    "duration_ms": 3184
}
The same logger can describe an individual RAG stage:
logger.info(
    "retrieval_completed",
    extra={
        "stage": "retrieval",
        "duration_ms": 84,
        "documents_retrieved": 20
    }
)
Or an error:
logger.error(
    "retrieval_failed",
    extra={
        "stage": "retrieval",
        "error_type":
            "RuntimeError"
    }
)
This gives us one consistent format for RAG API logging across FastAPI, retrieval, reranking, and LLM generation.
Use Consistent Event Names
When you add logging and monitoring to a RAG API, consistent event names make logs much easier to search. Use predictable names instead of writing a different sentence every time something happens.
For example:
request_started
request_completed

retrieval_completed
retrieval_failed

reranking_completed
reranking_failed

llm_completed
llm_failed

rag_completed
rag_failed
This makes queries such as message="llm_failed" or stage="retrieval" possible once the logs are sent to a centralized logging platform.
Do Not Log Sensitive RAG Data
Structured logging does not mean storing everything. A RAG API may process private documents, user questions, prompts, API keys, and retrieved context.
Avoid logging values such as:
API keys
Authorization headers
full user questions
complete prompts
retrieved document text
LLM credentials
Instead, record operational information:
status_code
duration_ms
stage
documents_retrieved
documents_in_context
error_type
This provides useful RAG monitoring data without unnecessarily copying sensitive content into the logging system.
Structured Logging in Docker
Because StreamHandler writes the logs to the container output, we do not need to maintain a separate log file inside the Docker image.
After starting the RAG API container, inspect the events with:
docker logs -f rag-apiLater, the same JSON output can be collected by a centralized logging system without changing the core FastAPI application.
We now have the first part required to add logging and monitoring to a RAG API: consistent structured events. However, these events still need a way to identify which messages belong to the same HTTP request. In the next step, we will add a unique request ID and propagate it through the FastAPI and RAG pipeline.
Step 2 — Add Request IDs to Trace RAG Requests
Structured logs become much more useful when every event generated by one API call shares the same identifier. The next step to add logging and monitoring to a RAG API is therefore to generate a unique request ID for every incoming request.
Without a request ID, logs from several simultaneous RAG requests can become mixed together:
retrieval_completed
llm_completed
retrieval_completed
reranking_completed
llm_failed
With request IDs, each event can be associated with the correct request:
request_id=7ad82f
├── retrieval_completed
├── reranking_completed
├── llm_completed
└── request_completed

request_id=91bc14
├── retrieval_completed
├── reranking_completed
├── llm_failed
└── request_completed
Create Request ID Middleware
FastAPI middleware is a convenient place to generate the identifier because it runs at the beginning of the HTTP request lifecycle.
Add these imports to app.py:
import time
import uuid

from fastapi import Request

from observability import logger
Then create the middleware:
@app.middleware("http")
async def request_logging(
    request: Request,
    call_next
):
    request_id = str(
        uuid.uuid4()
    )

    request.state.request_id = (
        request_id
    )

    start = time.perf_counter()

    logger.info(
        "request_started",
        extra={
            "request_id":
                request_id,
            "endpoint":
                request.url.path
        }
    )

    response = await call_next(
        request
    )

    duration_ms = round(
        (
            time.perf_counter()
            - start
        ) * 1000,
        2
    )

    response.headers[
        "X-Request-ID"
    ] = request_id

    logger.info(
        "request_completed",
        extra={
            "request_id":
                request_id,
            "endpoint":
                request.url.path,
            "status_code":
                response.status_code,
            "duration_ms":
                duration_ms
        }
    )

    return response
The middleware now performs four useful tasks:
- generates a unique request ID;
- stores it in
request.state; - records total HTTP request latency;
- returns the ID to the client through the
X-Request-IDheader.
Pass the Request ID into the RAG Pipeline
The FastAPI endpoint can retrieve the identifier from request.state and pass it into the RAG code:
@app.post(
    "/ask",
    dependencies=[
        Depends(verify_api_key)
    ]
)
@limiter.limit(RAG_RATE_LIMIT)
async def ask(
    request: Request,
    body: AskRequest
):
    request_id = (
        request.state.request_id
    )

    answer = ask_rag(
        body.question,
        request_id=request_id
    )

    return {
        "answer": answer
    }
Update the RAG function accordingly:
def ask_rag(
    question: str,
    request_id: str
):
    logger.info(
        "rag_started",
        extra={
            "request_id":
                request_id,
            "stage": "rag"
        }
    )

    # Retrieval, reranking
    # and LLM generation...

    return answer
Every important RAG event can now include the same identifier:
logger.info(
    "retrieval_completed",
    extra={
        "request_id":
            request_id,
        "stage": "retrieval",
        "documents_retrieved":
            len(candidates)
    }
)
This creates a simple trace through the application:
Client
   │
   ▼
request_id = 7ad82f
   │
   ▼
FastAPI
   │
   ▼
Retrieval
   │
   ▼
Reranking
   │
   ▼
LLM
   │
   ▼
Response

All events:
request_id = 7ad82f
Return the Request ID to the Client
Because the middleware adds:
X-Request-ID: 7ad82f...a client can report this identifier when something goes wrong. Instead of searching through thousands of RAG API logs by timestamp, you can search directly for the affected request ID.
This is especially useful for production RAG API monitoring because the same identifier connects the HTTP request with retrieval, reranking, LLM generation, and the final response.
Handle Unexpected Middleware Errors
If an unhandled exception occurs before a normal response is returned, we still want the request ID in the logs. Extend the middleware with a small exception handler:
try:
    response = await call_next(
        request
    )

except Exception as error:
    duration_ms = round(
        (
            time.perf_counter()
            - start
        ) * 1000,
        2
    )

    logger.exception(
        "request_failed",
        extra={
            "request_id":
                request_id,
            "endpoint":
                request.url.path,
            "status_code": 500,
            "duration_ms":
                duration_ms,
            "error_type":
                type(error).__name__
        }
    )

    raise
This ensures that unexpected failures still produce a structured event containing the request ID, endpoint, latency, and exception type.
Request IDs Are Not Authentication
A request ID should never be used as a security credential. It serves only as an observability identifier.
API Key
   └── Authentication


Request ID
   └── Log correlation
For the same reason, the server should generate its own request IDs rather than blindly trusting arbitrary client-provided identifiers.
We now have structured RAG API logging and a reliable way to correlate events from individual requests. The next step to add logging and monitoring to a RAG API is to measure how long retrieval, reranking, and LLM generation actually take, so slow requests can be traced to a specific stage of the RAG pipeline.
Step 3 — Measure RAG Pipeline Latency
Total API response time tells us whether a request is slow, but it does not explain why. To add logging and monitoring to a RAG API effectively, we need to measure the main stages of the RAG pipeline separately.
For our assistant, the most important latency measurements are:
RAG Request
   │
   ├── Retrieval
   │
   ├── Reranking
   │
   └── LLM Generation
   │
   ▼
Total RAG Latency
If a request takes four seconds, these measurements can show whether the delay comes from vector search, reranking, or the LLM.
Measure Elapsed Time with perf_counter()
Python’s time.perf_counter() is suitable for measuring elapsed execution time. Start a timer immediately before an operation and calculate the difference when it finishes:
start = time.perf_counter()

result = some_operation()

duration_ms = round(
    (
        time.perf_counter()
        - start
    ) * 1000,
    2
)
We can apply this pattern to each major RAG stage.
Measure Retrieval Latency
Start with the hybrid retrieval layer:
retrieval_start = (
    time.perf_counter()
)

candidates = hybrid_search(
    question
)

retrieval_ms = round(
    (
        time.perf_counter()
        - retrieval_start
    ) * 1000,
    2
)

logger.info(
    "retrieval_completed",
    extra={
        "request_id":
            request_id,
        "stage": "retrieval",
        "duration_ms":
            retrieval_ms,
        "documents_retrieved":
            len(candidates)
    }
)
The resulting structured log tells us both how long retrieval took and how many candidate documents were returned:
{
    "message":
        "retrieval_completed",
    "request_id":
        "7ad82f",
    "stage":
        "retrieval",
    "duration_ms":
        86.42,
    "documents_retrieved":
        20
}
This is more useful for RAG monitoring than measuring the entire request alone. If retrieval latency suddenly increases while LLM latency remains stable, the search layer becomes the first place to investigate.
Measure Reranking Latency
Apply the same approach to the reranker:
reranking_start = (
    time.perf_counter()
)

reranked = rerank_documents(
    question,
    candidates
)

reranking_ms = round(
    (
        time.perf_counter()
        - reranking_start
    ) * 1000,
    2
)

logger.info(
    "reranking_completed",
    extra={
        "request_id":
            request_id,
        "stage": "reranking",
        "duration_ms":
            reranking_ms
    }
)
Reranking can become expensive when too many candidates are passed to the model. Measuring this stage separately makes that behavior visible.
Measure LLM Latency
Generation is often the slowest stage of a RAG request, so it should have its own measurement:
llm_start = time.perf_counter()

answer = generate_answer(
    question,
    context
)

llm_ms = round(
    (
        time.perf_counter()
        - llm_start
    ) * 1000,
    2
)

logger.info(
    "llm_completed",
    extra={
        "request_id":
            request_id,
        "stage": "llm",
        "duration_ms":
            llm_ms
    }
)
We can now compare the three stages directly:
Retrieval      86 ms
Reranking     214 ms
LLM          2840 ms
────────────────────
RAG          3140+ ms
In this example, optimizing FAISS retrieval would have little effect on total response time because LLM generation dominates the request.
Measure the Complete RAG Pipeline
It is also useful to record one summary event for the complete pipeline. A simplified ask_rag() can now look like this:
def ask_rag(
    question: str,
    request_id: str
):
    rag_start = time.perf_counter()

    # Retrieval
    retrieval_start = (
        time.perf_counter()
    )

    candidates = hybrid_search(
        question
    )

    retrieval_ms = round(
        (
            time.perf_counter()
            - retrieval_start
        ) * 1000,
        2
    )

    # Reranking
    reranking_start = (
        time.perf_counter()
    )

    reranked = rerank_documents(
        question,
        candidates
    )

    reranking_ms = round(
        (
            time.perf_counter()
            - reranking_start
        ) * 1000,
        2
    )

    context_documents = (
        reranked[:5]
    )

    context = build_context(
        context_documents
    )

    # LLM
    llm_start = time.perf_counter()

    answer = generate_answer(
        question,
        context
    )

    llm_ms = round(
        (
            time.perf_counter()
            - llm_start
        ) * 1000,
        2
    )

    rag_ms = round(
        (
            time.perf_counter()
            - rag_start
        ) * 1000,
        2
    )

    logger.info(
        "rag_completed",
        extra={
            "request_id":
                request_id,
            "stage": "rag",
            "duration_ms":
                rag_ms,
            "documents_retrieved":
                len(candidates),
            "documents_in_context":
                len(context_documents)
        }
    )

    return answer
The individual stage events remain useful for debugging, while rag_completed provides a compact summary for the entire pipeline.
Compare HTTP and RAG Latency
We now measure latency at two levels:
HTTP Request
│
│  Authentication
│  Rate Limiting
│  Validation
│
├── RAG Pipeline
│   ├── Retrieval
│   ├── Reranking
│   └── LLM
│
└── Response Serialization
The middleware measures total HTTP latency, while ask_rag() measures the internal RAG pipeline.
For example:
HTTP duration:     3280 ms
RAG duration:      3215 ms

Difference:          65 ms
A small difference is expected. A large difference may indicate overhead outside the RAG pipeline, such as authentication, request handling, network operations, or another middleware component.
Keep Latency Logs Compact
When you add logging and monitoring to a RAG API, there is no need to create timers for every function. Measure the boundaries that help diagnose real performance problems.
For this RAG API, the most useful measurements are:
HTTP request
RAG pipeline
retrieval
reranking
LLM generation
These measurements provide enough detail to identify the main bottleneck without turning the application into a collection of timers.
We can now trace each request and determine where its execution time is spent. Next, we will extend RAG API monitoring with operational signals such as retrieval counts, LLM token usage, HTTP errors, and failures inside individual RAG stages.
Step 4 — Track RAG Errors and Usage
Latency tells us how fast the pipeline runs, but production RAG API monitoring should also show what the pipeline is doing. To add logging and monitoring to a RAG API, we need a few additional signals: retrieval volume, context size, LLM usage, HTTP status codes, and errors inside individual RAG stages.
Track Retrieved Documents
The number of retrieved documents is a simple but useful operational signal. Record it immediately after hybrid search:
candidates = hybrid_search(
    question
)

logger.info(
    "retrieval_completed",
    extra={
        "request_id":
            request_id,
        "stage": "retrieval",
        "documents_retrieved":
            len(candidates)
    }
)
After reranking and context selection, record how many documents will actually be sent to the LLM:
context_documents = (
    reranked[:5]
)

logger.info(
    "context_created",
    extra={
        "request_id":
            request_id,
        "stage": "context",
        "documents_in_context":
            len(context_documents)
    }
)
These measurements help detect unusual retrieval behavior. For example, an API can continue returning 200 OK while the search layer suddenly starts finding very few documents.
Normal:
documents_retrieved = 20

Problem:
documents_retrieved = 0
An empty result can therefore generate a warning:
if not candidates:
    logger.warning(
        "empty_retrieval",
        extra={
            "request_id":
                request_id,
            "stage": "retrieval",
            "documents_retrieved": 0
        }
    )
Track Errors by RAG Stage
A generic 500 Internal Server Error does not tell us whether retrieval, reranking, or generation failed. Structured RAG API logging should identify the failing stage.
For retrieval:
try:
    candidates = hybrid_search(
        question
    )

except Exception as error:
    logger.exception(
        "retrieval_failed",
        extra={
            "request_id":
                request_id,
            "stage": "retrieval",
            "error_type":
                type(error).__name__
        }
    )

    raise
Use the same pattern for reranking:
try:
    reranked = rerank_documents(
        question,
        candidates
    )

except Exception as error:
    logger.exception(
        "reranking_failed",
        extra={
            "request_id":
                request_id,
            "stage": "reranking",
            "error_type":
                type(error).__name__
        }
    )

    raise
And for LLM generation:
try:
    answer = generate_answer(
        question,
        context
    )

except Exception as error:
    logger.exception(
        "llm_failed",
        extra={
            "request_id":
                request_id,
            "stage": "llm",
            "error_type":
                type(error).__name__
        }
    )

    raise
Now a production error can be traced from the HTTP request directly to the component that failed:
request_id=7ad82f
        │
        ▼
retrieval_completed
        │
        ▼
reranking_completed
        │
        ▼
llm_failed
        │
        ▼
HTTP 500
This is much more useful than logging the same generic error at every layer. Record detailed exceptions where they occur, then let the API return a controlled error response.
Track HTTP Status Codes
When you add logging and monitoring to a RAG API, HTTP status codes provide a quick view of API health and client behavior.
The most relevant codes for our application are:
200 ── Successful RAG request
401 ── Invalid or missing API key
422 ── Invalid request body
429 ── Rate limit exceeded
500 ── Internal RAG/API error
Our request middleware already has access to the final response, so the completion event should include:
logger.info(
    "request_completed",
    extra={
        "request_id":
            request_id,
        "endpoint":
            request.url.path,
        "status_code":
            response.status_code,
        "duration_ms":
            duration_ms
    }
)
This lets us distinguish a failing RAG pipeline from requests rejected before retrieval even begins.
401 / 422 / 429
       │
       └── RAG may never execute


500
 │
 └── investigate API or RAG stage


200
 │
 └── successful HTTP response
Track LLM Token Usage
If your LLM provider returns usage information, token counts are useful for monitoring both context growth and model cost.
For example, extract the usage values in the generation layer:
prompt_tokens = (
    response.usage.prompt_tokens
)

completion_tokens = (
    response.usage.completion_tokens
)

total_tokens = (
    response.usage.total_tokens
)
The exact response structure depends on the LLM client and API version you use, so keep provider-specific extraction inside the generation layer.
Then add the values to a structured event:
logger.info(
    "llm_completed",
    extra={
        "request_id":
            request_id,
        "stage": "llm",
        "duration_ms":
            llm_ms,
        "prompt_tokens":
            prompt_tokens,
        "completion_tokens":
            completion_tokens,
        "total_tokens":
            total_tokens
    }
)
Add these optional fields to the JsonFormatter created earlier:
fields = [
    "request_id",
    "endpoint",
    "status_code",
    "stage",
    "duration_ms",
    "documents_retrieved",
    "documents_in_context",
    "prompt_tokens",
    "completion_tokens",
    "total_tokens",
    "error_type"
]
This makes it possible to identify changes such as:
Before:
average prompt size ≈ 2,000 tokens

After configuration change:
average prompt size ≈ 7,500 tokens
Even if latency remains acceptable, the second configuration may substantially increase LLM usage and cost.
Keep Logs Detailed but Metrics Bounded
At this stage, our logs contain request-level information such as:
request_id
status_code
duration_ms
stage
documents_retrieved
documents_in_context
token usage
error_type
Not all of these values should become metric labels. Unique values such as request_id are excellent for logs but would create extremely high-cardinality metrics.
For monitoring metrics, prefer a small set of controlled dimensions:
stage="retrieval"
stage="llm"

status="success"
status="error"

status_code="200"
status_code="500"
Never use full questions, prompts, document text, API keys, or request IDs as metric labels.
What We Can Monitor Now
After these changes, structured logging provides a compact operational picture of each RAG request:
Request
   │
   ├── request_id
   ├── HTTP status
   ├── total latency
   │
   ▼
RAG
   │
   ├── retrieval latency + count
   ├── reranking latency
   ├── context document count
   ├── LLM latency + tokens
   └── stage errors
These events are enough to investigate individual requests, but logs alone are inefficient for answering questions such as how many requests failed during the last hour or whether LLM latency is increasing over time.
The next step to add logging and monitoring to a RAG API is therefore to convert the most important signals into Prometheus counters and histograms. This will give us aggregated FastAPI monitoring and RAG performance metrics without increasing the amount of request-level data we store in logs.
Step 5 — Add Prometheus Metrics to FastAPI
Structured logs help us investigate individual requests. To monitor the RAG service over time, we also need aggregated metrics. The next step to add logging and monitoring to a RAG API is to expose request, latency, error, retrieval, and LLM metrics for Prometheus.
The monitoring flow will be:
RAG API
   │
   ├── Structured Logs
   │
   └── /metrics
          │
          ▼
      Prometheus
          │
          ▼
   Dashboards / Alerts
Create the Prometheus Metrics
Open observability.py and import the metric types:
from prometheus_client import (
    Counter,
    Histogram
)
We will use counters for requests, errors, and token usage, and histograms for latency and document counts.
Add the following definitions:
HTTP_REQUESTS = Counter(
    "rag_http_requests_total",
    "Total HTTP requests",
    [
        "endpoint",
        "status_code"
    ]
)


HTTP_DURATION = Histogram(
    "rag_request_duration_seconds",
    "RAG API request duration"
)


RAG_ERRORS = Counter(
    "rag_errors_total",
    "RAG pipeline errors",
    ["stage"]
)


RETRIEVAL_DURATION = Histogram(
    "rag_retrieval_duration_seconds",
    "Retrieval duration"
)


RERANKING_DURATION = Histogram(
    "rag_reranking_duration_seconds",
    "Reranking duration"
)


LLM_DURATION = Histogram(
    "rag_llm_duration_seconds",
    "LLM generation duration"
)


RETRIEVED_DOCUMENTS = Histogram(
    "rag_retrieved_documents",
    "Documents retrieved per request"
)


LLM_TOKENS = Counter(
    "rag_llm_tokens_total",
    "LLM tokens used",
    ["type"]
)
These metrics cover the main operational questions without creating unnecessary complexity.
Record HTTP Metrics
Update the FastAPI middleware so it records the final status code and total request duration:
from observability import (
    HTTP_DURATION,
    HTTP_REQUESTS,
    logger
)


@app.middleware("http")
async def request_logging(
    request: Request,
    call_next
):
    request_id = str(
        uuid.uuid4()
    )

    request.state.request_id = (
        request_id
    )

    start = time.perf_counter()

    try:
        response = await call_next(
            request
        )

    except Exception as error:
        logger.exception(
            "request_failed",
            extra={
                "request_id":
                    request_id,
                "endpoint":
                    request.url.path,
                "status_code": 500,
                "error_type":
                    type(error).__name__
            }
        )

        raise

    duration_seconds = (
        time.perf_counter()
        - start
    )

    duration_ms = round(
        duration_seconds * 1000,
        2
    )

    HTTP_REQUESTS.labels(
        endpoint=request.url.path,
        status_code=str(
            response.status_code
        )
    ).inc()

    HTTP_DURATION.observe(
        duration_seconds
    )

    response.headers[
        "X-Request-ID"
    ] = request_id

    logger.info(
        "request_completed",
        extra={
            "request_id":
                request_id,
            "endpoint":
                request.url.path,
            "status_code":
                response.status_code,
            "duration_ms":
                duration_ms
        }
    )

    return response
Notice that Prometheus latency is stored in seconds, while our logs continue to use milliseconds for readability.
Record RAG Stage Metrics
The same measurements already used for structured RAG API logging can feed Prometheus.
For retrieval:
retrieval_start = (
    time.perf_counter()
)

candidates = hybrid_search(
    question
)

retrieval_seconds = (
    time.perf_counter()
    - retrieval_start
)

RETRIEVAL_DURATION.observe(
    retrieval_seconds
)

RETRIEVED_DOCUMENTS.observe(
    len(candidates)
)
For reranking:
reranking_start = (
    time.perf_counter()
)

reranked = rerank_documents(
    question,
    candidates
)

reranking_seconds = (
    time.perf_counter()
    - reranking_start
)

RERANKING_DURATION.observe(
    reranking_seconds
)
And for generation:
llm_start = time.perf_counter()

answer = generate_answer(
    question,
    context
)

llm_seconds = (
    time.perf_counter()
    - llm_start
)

LLM_DURATION.observe(
    llm_seconds
)
This allows RAG monitoring to compare retrieval, reranking, and LLM latency independently rather than relying only on total API response time.
Count Errors by Stage
When a RAG stage fails, increment the corresponding error counter:
except Exception as error:
    RAG_ERRORS.labels(
        stage="retrieval"
    ).inc()

    logger.exception(
        "retrieval_failed",
        extra={
            "request_id":
                request_id,
            "stage": "retrieval",
            "error_type":
                type(error).__name__
        }
    )

    raise
Use the same approach for:
stage="reranking"

stage="llm"
Prometheus can then show whether errors are concentrated in search, reranking, or generation.
Record LLM Token Usage
If the LLM integration returns token usage, increment the counter using a controlled type label:
LLM_TOKENS.labels(
    type="input"
).inc(
    prompt_tokens
)

LLM_TOKENS.labels(
    type="output"
).inc(
    completion_tokens
)
This provides a useful signal for model usage without exposing prompts or user content.
Expose the /metrics Endpoint
Prometheus needs an endpoint from which it can collect the measurements. Add these imports to app.py:
from fastapi import Response

from prometheus_client import (
    CONTENT_TYPE_LATEST,
    generate_latest
)
Then create the endpoint:
@app.get(
    "/metrics",
    include_in_schema=False
)
def metrics():
    return Response(
        content=generate_latest(),
        media_type=CONTENT_TYPE_LATEST
    )
You can now open:
http://localhost:8000/metricsand receive Prometheus-compatible output such as:
rag_http_requests_total{
  endpoint="/ask",
  status_code="200"
} 42.0

rag_errors_total{
  stage="llm"
} 2.0

rag_llm_tokens_total{
  type="input"
} 68421.0
Connect Prometheus to the RAG API
Prometheus periodically requests the /metrics endpoint and stores the results as time-series data.
A minimal scrape configuration for a Docker environment might look like:
scrape_configs:

  - job_name: "rag-api"

    static_configs:

      - targets:
          - "rag-api:8000"
Here, rag-api must be a hostname that the Prometheus container can reach, for example a service name on the same Docker network.
For a broader explanation of how Prometheus collects and stores monitoring data, see the official Prometheus documentation.
Avoid High-Cardinality Metrics
An important rule when you add logging and monitoring to a RAG API is to keep Prometheus labels predictable.
Good metric labels have a limited number of possible values:
status_code="200"

stage="retrieval"

type="input"

endpoint="/ask"
Do not create labels from unique or user-generated values:
request_id
question
prompt
document text
API key
full error message
Those values belong in structured logs when appropriate, not in Prometheus labels.
Protect the Metrics Endpoint
The /metrics endpoint contains operational information about the application and should generally not be exposed as a public API endpoint.
A production deployment can allow Prometheus to reach it through an internal network while blocking external access:
Internet
   │
   ▼
Reverse Proxy
   │
   ├── /ask ─────► RAG API
   │
   └── /metrics ─► Blocked


Prometheus
   │
   │ Internal Network
   ▼
/metrics
The exact restriction depends on the deployment environment, but the principle remains the same: monitoring infrastructure should be able to scrape the endpoint without unnecessarily exposing internal metrics to the internet.
Logs and Metrics Now Work Together
We now have two complementary observability layers:
Structured Logs
│
├── request_id
├── individual errors
├── stage events
└── request details


Prometheus Metrics
│
├── request volume
├── status codes
├── latency
├── RAG errors
├── retrieval behavior
└── LLM usage
If Prometheus shows that LLM errors are increasing, structured logs can identify the affected requests and provide the corresponding exception details.
This combination provides the core infrastructure needed to add logging and monitoring to a RAG API. In the next step, we will test the complete setup by checking request IDs, JSON logs, HTTP errors, latency measurements, and the Prometheus /metrics endpoint.
Step 6 — Test RAG Logging and Monitoring
After you add logging and monitoring to a RAG API, verify that structured logs, request IDs, latency measurements, errors, and Prometheus metrics work together correctly.
Start the FastAPI application:
uvicorn app:app \
  --host 0.0.0.0 \
  --port 8000
Or, if you are using Docker:
docker run \
  -d \
  --name rag-api \
  -p 8000:8000 \
  --env-file .env \
  rag-assistant:1.3.0
Test a Successful RAG Request
Send a valid request to the protected /ask endpoint:
curl \
  -i \
  -X POST \
  http://localhost:8000/ask \
  -H "Content-Type: application/json" \
  -H "X-API-Key: development-secret" \
  -d '{
    "question":
      "What is hybrid search in RAG?"
  }'
The response should return 200 OK together with an X-Request-ID header:
HTTP/1.1 200 OK
X-Request-ID:
7ad82f19-2f4d-4a5d-8f21-4ab135c11e72
The logs should contain events for the same request:
request_started
      │
      ▼
retrieval_completed
      │
      ▼
reranking_completed
      │
      ▼
llm_completed
      │
      ▼
rag_completed
      │
      ▼
request_completed
All of these events should contain the same request_id. This confirms that RAG API logging can correlate activity across the complete pipeline.
Inspect the Structured Logs
If the application runs in Docker, follow the logs with:
docker logs -f rag-apiA successful request may produce events such as:
{
  "level": "INFO",
  "message": "retrieval_completed",
  "request_id": "7ad82f19",
  "stage": "retrieval",
  "duration_ms": 82.4,
  "documents_retrieved": 20
}

{
  "level": "INFO",
  "message": "llm_completed",
  "request_id": "7ad82f19",
  "stage": "llm",
  "duration_ms": 2718.6
}

{
  "level": "INFO",
  "message": "request_completed",
  "request_id": "7ad82f19",
  "endpoint": "/ask",
  "status_code": 200,
  "duration_ms": 3041.7
}
Check that the logs contain operational metadata but do not expose the API key, complete prompt, retrieved document text, or other sensitive content.
Test HTTP Errors
Next, verify that requests rejected before the RAG pipeline are still visible to FastAPI monitoring.
Send a request without the API key:
curl \
  -i \
  -X POST \
  http://localhost:8000/ask \
  -H "Content-Type: application/json" \
  -d '{
    "question":
      "Explain semantic search."
  }'
The expected result is:
HTTP/1.1 401 UnauthorizedYou can also send an invalid request body:
curl \
  -i \
  -X POST \
  http://localhost:8000/ask \
  -H "Content-Type: application/json" \
  -H "X-API-Key: development-secret" \
  -d '{
    "question": "a"
  }'
If the request model requires a longer question, FastAPI should return 422.
Repeated requests beyond the configured rate limit should eventually return:
HTTP/1.1 429 Too Many RequestsThese tests confirm that RAG API monitoring covers authentication, validation, and rate limiting in addition to successful RAG execution.
Check the Prometheus Metrics
Request the monitoring endpoint:
curl \
  http://localhost:8000/metrics
After several test requests, look for the metrics created earlier:
rag_http_requests_total

rag_request_duration_seconds

rag_retrieval_duration_seconds

rag_reranking_duration_seconds

rag_llm_duration_seconds

rag_errors_total

rag_retrieved_documents

rag_llm_tokens_total
For example, the HTTP counter may contain:
rag_http_requests_total{
  endpoint="/ask",
  status_code="200"
} 8.0

rag_http_requests_total{
  endpoint="/ask",
  status_code="401"
} 1.0

rag_http_requests_total{
  endpoint="/ask",
  status_code="429"
} 2.0
Latency histograms should also contain _count, _sum, and _bucket series. Their values will increase as additional RAG requests are processed.
Test a RAG Failure
During development, you can temporarily raise an exception inside one stage to verify error monitoring:
raise RuntimeError(
    "Test LLM failure"
)
A failure inside the LLM stage should generate a structured event such as:
{
  "message": "llm_failed",
  "request_id": "91bc14",
  "stage": "llm",
  "error_type": "RuntimeError"
}
The Prometheus counter should also increase:
rag_errors_total{
  stage="llm"
} 1.0
Remove the test exception after confirming the behavior.
Verify the Complete Observability Flow
At this point, one request should be visible at both the request level and the service level:
Client
   │
   ▼
Request ID
   │
   ▼
FastAPI
   │
   ▼
RAG Pipeline
   │
   ├── Retrieval
   ├── Reranking
   └── LLM
   │
   ▼
Response
   │
   ├────────► JSON Logs
   │
   └────────► Prometheus Metrics
Structured logs answer what happened to a specific request, while Prometheus shows how the RAG API behaves across many requests. Together, these tests confirm that the core implementation to add logging and monitoring to a RAG API is working correctly.
Production Monitoring Considerations
The monitoring setup is now ready for development, but a production deployment requires a few additional decisions. When you add logging and monitoring to a RAG API, the goal is to collect useful operational data without exposing sensitive information or creating unnecessary monitoring overhead.
Centralize Structured Logs
Our FastAPI application writes JSON logs to standard output, which works well with containers:
FastAPI
   │
   ▼
stdout
   │
   ▼
Docker
   │
   ▼
Central Log Storage
In production, logs from multiple RAG API instances should normally be collected in one place. Fields such as request_id, stage, status_code, and error_type then make it possible to search and filter events without reading raw container output.
Protect Sensitive Data
RAG applications can process private documents and user questions, so production logging should avoid storing content unless there is a specific reason to do so.
Do not log:
API keys
authorization headers
full prompts
private document chunks
credentials
complete user questions
Operational fields such as latency, document counts, token usage, status codes, and error types are usually sufficient for RAG API monitoring.
Also define how long logs are retained and who can access them. Monitoring data should have the same security and retention planning as other production data.
Protect /metrics
The Prometheus /metrics endpoint can reveal internal information about traffic, latency, errors, and application behavior. It should generally be available to the monitoring infrastructure rather than the public internet.
Internet
   │
   ▼
RAG API
   │
   └── /metrics
          ▲
          │
    Internal Access
          │
      Prometheus
Access can be restricted at the reverse proxy, firewall, private network, or infrastructure layer depending on the deployment architecture.
Monitor Multiple RAG API Instances
If the application is scaled horizontally, each instance exposes its own metrics:
RAG API 1 ──► /metrics ──┐
                          │
RAG API 2 ──► /metrics ──┼──► Prometheus
                          │
RAG API 3 ──► /metrics ──┘
Prometheus can scrape the instances and aggregate their measurements to provide service-level FastAPI monitoring.
Multiple Python worker processes require additional care because Prometheus counters and histograms are normally maintained in process memory. If you deploy multiple workers inside one container, configure the Prometheus Python client’s multiprocess support rather than assuming that one process can report metrics for all workers.
Create Alerts for Meaningful Conditions
Production monitoring becomes useful when important changes generate alerts. Avoid alerting on every individual failed request. Instead, monitor trends such as:
- increasing
5xxerror rate; - high request or LLM latency;
- a sudden increase in
429responses; - repeated retrieval failures or empty results;
- unexpected growth in LLM token usage.
For example, one LLM failure may be harmless, while an elevated LLM error rate for several minutes can indicate a real production problem.
Request IDs Are Not Distributed Tracing
The request IDs implemented in this tutorial provide correlation across FastAPI, retrieval, reranking, and LLM logs. They are useful for tracing activity inside our application, but they are not a complete distributed tracing system.
As a RAG architecture grows to include separate search services, vector databases, model gateways, and other APIs, distributed tracing can provide deeper visibility across service boundaries.
Keep Monitoring Focused
It is possible to collect hundreds of metrics, but more data does not automatically produce better observability. Start with signals that answer practical questions:
Is the RAG API available?

How many requests fail?

Which RAG stage is slow?

Where do errors occur?

Is retrieval behaving normally?

Is LLM usage changing?
This keeps the implementation to add logging and monitoring to a RAG API useful and maintainable while still providing enough information to diagnose the most important production problems.
Where to Go Next
You now have the core infrastructure required to add logging and monitoring to a RAG API. The FastAPI service can correlate requests, measure individual RAG stages, record failures, and expose aggregated Prometheus metrics.
If you are building the complete production RAG stack step by step, these tutorials provide useful context for the monitoring layer:
- Deploy a RAG Assistant with FastAPI — expose the RAG pipeline through a production-oriented API.
- Dockerize a RAG Assistant with FastAPI — package the API and run it consistently in containers.
- Add Authentication and Rate Limiting to a RAG API — protect the API and control excessive requests.
- Evaluate a RAG System in Python — measure retrieval and answer quality in addition to operational performance.
- Build Reranking for RAG in Python — improve the relevance of documents before they reach the LLM.
- Build Hybrid Search for RAG in Python — combine BM25 and vector search for stronger retrieval.
Operational monitoring and RAG evaluation solve different problems. Prometheus can show that retrieval is fast and the API is healthy, while RAG evaluation determines whether the retrieved documents and generated answers are actually relevant.
Production RAG
│
├── Logging
├── Monitoring
├── Security
├── Rate Limiting
└── Deployment

RAG Quality
│
├── Retrieval Evaluation
├── Reranking Evaluation
└── Answer Evaluation
Together, these layers move the project from a working RAG prototype toward a system that can be deployed, measured, diagnosed, and improved in production.
Frequently Asked Questions
Why should I add logging and monitoring to a RAG API?
When you add logging and monitoring to a RAG API, you can see what happens inside retrieval, reranking, LLM generation, and the FastAPI layer. This makes it easier to diagnose errors, find latency bottlenecks, detect unusual retrieval behavior, and monitor the service after deployment.
What should a RAG API log?
Useful structured log fields include the request ID, HTTP status code, RAG stage, execution time, number of retrieved documents, number of documents added to context, token usage, and error type. These fields provide useful diagnostic information without requiring complete prompts or document content.
Should I log user questions and LLM prompts?
Not by default. Questions, prompts, retrieved chunks, and generated answers may contain private or sensitive information. For most RAG API monitoring, operational metadata is sufficient. If content logging is required, use appropriate redaction, access controls, and retention policies.
What is a request ID?
A request ID is a unique identifier assigned to an incoming API request. The same ID is included in FastAPI, retrieval, reranking, and LLM log events, allowing one request to be followed through the complete RAG pipeline.
A request ID is used for observability and should not be treated as an authentication credential.
What is the difference between logs and metrics?
Logs describe individual events, while metrics summarize system behavior over time.
Logs
└── What happened to this request?


Metrics
└── How is the system behaving overall?
A production RAG system benefits from both. Prometheus may reveal an increase in LLM errors, while structured logs can identify the specific requests and exceptions involved.
What RAG metrics should I monitor?
A practical starting set includes total request latency, retrieval latency, reranking latency, LLM latency, HTTP status codes, RAG errors by stage, retrieved document counts, and LLM token usage.
These measurements provide useful RAG monitoring without creating an unnecessarily complex observability system.
Why use Prometheus for RAG API monitoring?
Prometheus collects time-series metrics from the application and makes it possible to analyze request rates, latency distributions, errors, and other operational measurements over time. The FastAPI application only needs to expose the metrics through an endpoint that Prometheus can scrape.
Should the /metrics endpoint be public?
Generally, no. The /metrics endpoint can reveal information about application traffic, errors, latency, and internal behavior. In production, it is usually better to restrict the endpoint to Prometheus or other authorized monitoring infrastructure.
Can Prometheus monitor multiple RAG API containers?
Yes. Prometheus can scrape metrics from multiple application instances and aggregate them during queries. This makes the same monitoring approach useful when the RAG API is scaled horizontally across several containers or hosts.
Are request IDs the same as distributed tracing?
No. Request IDs provide simple correlation between events inside the application. Distributed tracing goes further by following operations across multiple services and recording individual spans. Request IDs are a useful starting point, while distributed tracing becomes more valuable as the RAG architecture grows.
Does monitoring measure RAG answer quality?
Not directly. Logging and Prometheus metrics measure operational behavior such as latency, errors, retrieval counts, and model usage. Evaluating whether retrieved documents are relevant and generated answers are correct requires a separate RAG evaluation process.
For a production system, both are important: monitoring tells you whether the system is operating normally, while evaluation tells you whether the RAG pipeline is producing useful results.
Conclusion
A production RAG system needs more than accurate retrieval and useful LLM responses. Once the application starts serving real users, you also need to understand how requests move through the pipeline, where failures occur, and which components create latency.
In this tutorial, we learned how to add logging and monitoring to a RAG API built with FastAPI. We added structured JSON logging, unique request IDs, latency measurements for retrieval, reranking, and LLM generation, error tracking, retrieval statistics, and LLM token usage.
We then exposed the most important operational signals as Prometheus metrics:
FastAPI Request
      │
      ▼
Request ID
      │
      ▼
RAG Pipeline
      │
      ├── Retrieval
      ├── Reranking
      └── LLM
      │
      ├────────► Structured Logs
      │
      └────────► Prometheus Metrics
The two layers complement each other. Metrics reveal trends across the entire service, while structured logs help investigate individual requests and failures.
With authentication, rate limiting, Docker deployment, structured logging, and Prometheus monitoring in place, the RAG API now has a much stronger production foundation. The next logical step is distributed tracing, which can extend this observability model across vector databases, model services, and other components as the architecture grows.