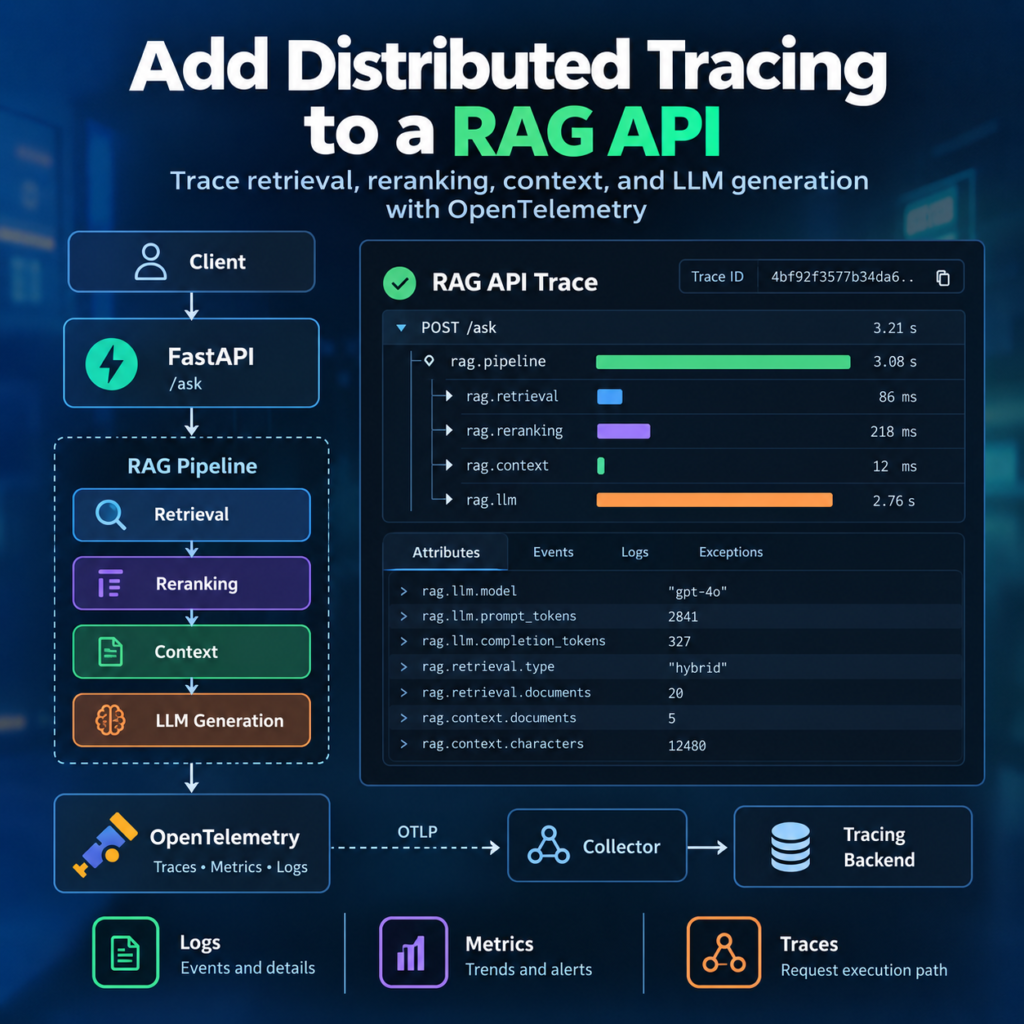
What You Will Build
In the previous tutorial, we added structured logging and Prometheus monitoring to our production RAG API. We can now measure request latency, track errors, monitor retrieval behavior, and investigate individual requests using request IDs.
But a request ID only tells us which log events belong together. It does not show the complete execution path of a request or how much time was spent inside each operation.
In this tutorial, we will add distributed tracing to a RAG API using OpenTelemetry and FastAPI.
We will continue working with the same production RAG assistant built throughout this tutorial series:
Client
  │
  ▼
FastAPI /ask
  │
  ├── Authentication
  ├── Rate Limiting
  │
  ▼
RAG Pipeline
  │
  ├── Metadata Filtering
  ├── Hybrid Search
  │     ├── BM25
  │     └── FAISS
  ├── Reranking
  ├── Context Building
  │
  ▼
LLM
  │
  ▼
Response
Instead of observing this pipeline only through separate log events and metrics, we will represent one RAG request as a trace.
RAG Request Trace
│
├── POST /ask
│
├── retrieval
│
│   ├── BM25 search
│   └── vector search
│
├── reranking
│
├── context building
│
└── LLM generation
Each operation becomes a span. A span records when an operation starts, when it finishes, how long it takes, and useful metadata about that operation.
For example, instead of seeing several independent latency values:
retrieval_ms = 84
reranking_ms = 216
llm_ms = 2810
request_ms = 3197
a distributed trace shows their relationship:
POST /ask ───────────────────────────── 3197 ms
   │
   ├── retrieval ── 84 ms
   │
   ├── reranking ───── 216 ms
   │
   ├── context ─ 12 ms
   │
   └── LLM ───────────────────── 2810 ms
This makes it much easier to understand where time is spent inside a RAG request and where a failure occurred.
What We Will Add
By the end of the tutorial, the API will include:
- OpenTelemetry instrumentation for FastAPI;
- a trace for every RAG API request;
- custom spans for retrieval, reranking, context building, and LLM generation;
- span attributes for useful RAG metadata;
- exception and error information inside traces;
- a trace exporter for sending telemetry to a tracing backend;
- correlation between traces and our existing observability data.
The resulting observability architecture will look like this:
                 RAG API
                    │
          ┌─────────┼─────────┐
          │         │         │
          ▼         ▼         ▼
        Logs      Metrics    Traces
          │         │         │
          ▼         ▼         ▼
     Request ID  Prometheus  OpenTelemetry
                              │
                              ▼
                         Trace Backend
Logs help us investigate individual events. Metrics reveal trends across many requests. Traces show how one request moves through the complete RAG pipeline.
Together, these three signals provide a much clearer picture of a production RAG system. We will build the tracing layer step by step, starting with the existing FastAPI application and adding OpenTelemetry without changing the core retrieval or generation logic.
Prerequisites
Before we add distributed tracing to a RAG API, we will assume that the existing FastAPI application is already running. We will extend the same project used in the previous production RAG tutorials rather than create a new application from scratch.
The API should already contain a protected /ask endpoint connected to the RAG pipeline:
@app.post(
    "/ask",
    dependencies=[
        Depends(verify_api_key)
    ]
)
@limiter.limit(RAG_RATE_LIMIT)
async def ask(
    request: Request,
    body: AskRequest
):
    request_id = (
        request.state.request_id
    )

    answer = ask_rag(
        body.question,
        request_id=request_id
    )

    return {
        "answer": answer
    }
Our existing ask_rag() function already separates the main RAG stages:
def ask_rag(
    question,
    request_id
):
    candidates = hybrid_search(
        question
    )

    reranked = rerank_documents(
        question,
        candidates
    )

    context_documents = (
        reranked[:5]
    )

    context = build_context(
        context_documents
    )

    answer = generate_answer(
        question,
        context
    )

    return answer
This separation is important for distributed tracing because each meaningful RAG operation can become its own span.
Existing Observability
We will also keep the observability components created in the previous tutorial:
- structured JSON logging;
- request IDs;
- request and RAG stage latency measurements;
- error logging;
- Prometheus metrics.
OpenTelemetry does not replace these components. Distributed tracing adds another observability signal that shows how operations relate to each other during a single request.
Install OpenTelemetry
Install the OpenTelemetry packages required for FastAPI instrumentation and trace exporting:
pip install \
  opentelemetry-api \
  opentelemetry-sdk \
  opentelemetry-instrumentation-fastapi \
  opentelemetry-exporter-otlp-proto-grpc
Then add them to requirements.txt:
fastapi
uvicorn
slowapi
prometheus-client

opentelemetry-api
opentelemetry-sdk
opentelemetry-instrumentation-fastapi
opentelemetry-exporter-otlp-proto-grpc

openai
sentence-transformers
faiss-cpu
rank-bm25
numpy
The OpenTelemetry API provides the tracing interface, while the SDK creates and processes spans. FastAPI instrumentation automatically traces incoming HTTP requests, and the OTLP exporter allows those traces to be sent to a compatible tracing backend.
Update the Project Structure
We will keep tracing configuration separate from the main API code:
rag-assistant/
│
├── app.py
├── rag.py
├── observability.py
├── tracing.py
├── requirements.txt
├── Dockerfile
├── .dockerignore
└── data/
The new tracing.py module will contain the OpenTelemetry configuration, while custom RAG spans will be created around the operations in rag.py.
If the application runs in Docker, rebuild the image after updating the dependencies:
docker build \
  -t rag-assistant:1.4.0 .
With the existing RAG pipeline and the OpenTelemetry packages ready, we can now instrument FastAPI and generate the first trace for an incoming request.
Step 1 — Instrument the FastAPI RAG API
The first practical step to add distributed tracing to a RAG API is to instrument FastAPI itself. OpenTelemetry can automatically create a span for every incoming HTTP request, giving us the root span that the rest of the RAG pipeline will use.
Instead of manually creating a trace when /ask is called, we will let OpenTelemetry instrument the FastAPI application automatically.
Configure the OpenTelemetry Tracer
Create tracing.py and add the basic OpenTelemetry configuration:
from opentelemetry import trace

from opentelemetry.sdk.resources import (
    Resource
)

from opentelemetry.sdk.trace import (
    TracerProvider
)

from opentelemetry.sdk.trace.export import (
    BatchSpanProcessor
)


def configure_tracing(
    exporter
):
    resource = Resource.create({
        "service.name":
            "rag-assistant-api"
    })

    provider = TracerProvider(
        resource=resource
    )

    processor = BatchSpanProcessor(
        exporter
    )

    provider.add_span_processor(
        processor
    )

    trace.set_tracer_provider(
        provider
    )

    return trace.get_tracer(
        "rag-assistant"
    )
The TracerProvider manages tracing for the application. The BatchSpanProcessor collects completed spans and sends them to the exporter in batches instead of exporting every span synchronously during the request.
We also define:
service.name = rag-assistant-apiThe service name becomes especially useful when distributed tracing includes several applications. A trace backend can distinguish spans produced by the RAG API from spans produced by other services.
Configure an OTLP Exporter
Next, configure the exporter that will send traces outside the FastAPI process:
import os

from opentelemetry.exporter.otlp.proto.grpc.trace_exporter import (
    OTLPSpanExporter
)


def create_trace_exporter():

    endpoint = os.getenv(
        "OTEL_EXPORTER_OTLP_ENDPOINT",
        "http://localhost:4317"
    )

    return OTLPSpanExporter(
        endpoint=endpoint,
        insecure=True
    )
For local development, port 4317 is commonly used for OTLP over gRPC. In production, the endpoint should come from configuration rather than being hardcoded into the application.
We can now initialize tracing:
exporter = (
    create_trace_exporter()
)

tracer = configure_tracing(
    exporter
)
At this point, we have configured the OpenTelemetry SDK, but FastAPI requests are not yet automatically instrumented.
Instrument FastAPI
Open app.py and import the FastAPI instrumentation:
from opentelemetry.instrumentation.fastapi import (
    FastAPIInstrumentor
)

from tracing import tracer
After creating the FastAPI application, instrument it:
app = FastAPI(
    title="RAG Assistant API"
)

FastAPIInstrumentor.instrument_app(
    app
)
OpenTelemetry will now create spans for incoming HTTP requests automatically.
When a client sends:
POST /askthe RAG API tracing flow begins with an HTTP span:
Trace
│
└── POST /ask
      │
      ├── start time
      ├── duration
      ├── HTTP method
      ├── route
      └── status code
This span becomes the parent for the custom spans we will create later for retrieval, reranking, context construction, and LLM generation.
Understand Trace and Span IDs
Every trace has a trace ID, and every span has its own span ID.
Trace ID: 4bf92f3577b34da6...

POST /ask
Span ID: a12f34...
│
├── retrieval
│   Span ID: b81c72...
│
├── reranking
│   Span ID: c51a18...
│
└── llm
    Span ID: d24e63...
The trace ID identifies the complete request path. Span IDs identify individual operations inside that trace.
This is one of the main differences between our existing request ID and OpenTelemetry tracing. A request ID correlates log records, while a trace contains a structured parent-child model of the operations performed during the request.
Access the Current Trace
OpenTelemetry propagates the active tracing context through the request. Code running inside the FastAPI request can access the current span:
from opentelemetry import trace


current_span = (
    trace.get_current_span()
)

span_context = (
    current_span.get_span_context()
)

trace_id = format(
    span_context.trace_id,
    "032x"
)

span_id = format(
    span_context.span_id,
    "016x"
)
This makes it possible to include the OpenTelemetry trace ID in structured logs later:
{
  "message": "retrieval_completed",
  "request_id": "7ad82f19",
  "trace_id": "4bf92f3577b34da6...",
  "stage": "retrieval",
  "duration_ms": 84.2
}
Now the same RAG request can be investigated from two directions:
Structured Log
     │
     └── trace_id
            │
            ▼
       Distributed Trace


Distributed Trace
     │
     └── request_id
            │
            ▼
      Structured Logs
This correlation becomes particularly valuable when we add distributed tracing to a RAG API that already has structured logging and Prometheus monitoring.
Keep Automatic and Custom Instrumentation Separate
FastAPI instrumentation should handle the HTTP layer. We do not need to manually create another span around the entire /ask endpoint because that would duplicate information already captured by the automatically generated HTTP span.
Instead, we will use custom spans only where they add information about the RAG pipeline:
Automatic instrumentation
│
└── POST /ask
      │
      └── Custom RAG instrumentation
            │
            ├── retrieval
            ├── reranking
            ├── context
            └── llm
This gives us a clean trace hierarchy without unnecessary spans.
FastAPI instrumentation gives us the starting point for distributed tracing in a RAG API. The next step is to create custom OpenTelemetry spans around the RAG pipeline so that one trace shows exactly how the request moves through retrieval, reranking, context building, and generation.
Step 2 — Create Spans for the RAG Pipeline
FastAPI instrumentation gives us the root HTTP span, but it cannot automatically understand the internal structure of our RAG pipeline. To add distributed tracing to a RAG API effectively, we need custom spans around the operations that matter for retrieval and generation.
Our goal is to transform a single HTTP span:
POST /ask
└── 3.2 seconds
into a trace that explains how those 3.2 seconds were spent:
POST /ask ─────────────────────────────── 3.2 s
│
├── rag.retrieval ── 86 ms
├── rag.reranking ───── 218 ms
├── rag.context ─ 11 ms
└── rag.llm ────────────────────── 2.8 s
Get a Tracer in the RAG Module
Open rag.py and import the OpenTelemetry tracing API:
from opentelemetry import trace


tracer = trace.get_tracer(
    "rag-assistant.rag"
)
The tracer is used to create spans around individual RAG operations. Because ask_rag() runs inside the active FastAPI request, OpenTelemetry automatically connects these spans to the existing HTTP trace.
We do not need to manually pass a trace ID from app.py into every function.
Create a Retrieval Span
Start with hybrid retrieval:
with tracer.start_as_current_span(
    "rag.retrieval"
):
    candidates = hybrid_search(
        question
    )
The context manager starts the span before retrieval and closes it when the operation finishes.
The resulting trace now contains:
POST /ask
│
└── rag.retrieval
The retrieval span automatically records its start time and duration. We no longer need to calculate duration manually for the purpose of tracing, although the existing timers can remain because they are still used by logs and Prometheus metrics.
Add a Reranking Span
Apply the same pattern to reranking:
with tracer.start_as_current_span(
    "rag.reranking"
):
    reranked = rerank_documents(
        question,
        candidates
    )
Now RAG API tracing can distinguish search latency from reranking latency:
POST /ask
│
├── rag.retrieval
│
└── rag.reranking
This distinction matters because both stages can become performance bottlenecks for different reasons. Retrieval may depend on vector search or BM25 performance, while reranking may use a more computationally expensive model.
Trace Context Building
Context construction is usually much faster than retrieval or LLM generation, but it can still be useful to trace because this is where retrieved documents are selected and prepared for the model.
with tracer.start_as_current_span(
    "rag.context"
):
    context_documents = (
        reranked[:5]
    )

    context = build_context(
        context_documents
    )
The trace now represents three distinct RAG operations:
POST /ask
│
├── rag.retrieval
├── rag.reranking
└── rag.context
Create an LLM Span
Finally, create a span around generation:
with tracer.start_as_current_span(
    "rag.llm"
):
    answer = generate_answer(
        question,
        context
    )
For many RAG applications, this will be the longest span in the trace because generation often takes considerably longer than local retrieval operations.
We now have the complete high-level execution path:
POST /ask
│
├── rag.retrieval
├── rag.reranking
├── rag.context
└── rag.llm
Combine the Spans in ask_rag()
The simplified ask_rag() function can now look like this:
from opentelemetry import trace


tracer = trace.get_tracer(
    "rag-assistant.rag"
)


def ask_rag(
    question,
    request_id
):

    with tracer.start_as_current_span(
        "rag.retrieval"
    ):
        candidates = hybrid_search(
            question
        )

    with tracer.start_as_current_span(
        "rag.reranking"
    ):
        reranked = rerank_documents(
            question,
            candidates
        )

    with tracer.start_as_current_span(
        "rag.context"
    ):
        context_documents = (
            reranked[:5]
        )

        context = build_context(
            context_documents
        )

    with tracer.start_as_current_span(
        "rag.llm"
    ):
        answer = generate_answer(
            question,
            context
        )

    return answer
The important point is that the tracing code does not change the actual RAG logic. Retrieval still returns candidates, reranking still reorders them, context building still prepares the selected documents, and the LLM still generates the final answer.
OpenTelemetry simply records the boundaries between these operations.
Should We Create a Parent RAG Span?
We can also create a parent span representing the complete RAG pipeline:
with tracer.start_as_current_span(
    "rag.pipeline"
):
    # retrieval
    # reranking
    # context
    # LLM
This produces a more explicit hierarchy:
POST /ask
│
└── rag.pipeline
      │
      ├── rag.retrieval
      ├── rag.reranking
      ├── rag.context
      └── rag.llm
For our application, this structure is useful because the HTTP request and the RAG pipeline are not exactly the same operation. The HTTP request also includes authentication, rate limiting, request parsing, response serialization, and middleware.
Let’s therefore update ask_rag() to include the parent span:
def ask_rag(
    question,
    request_id
):

    with tracer.start_as_current_span(
        "rag.pipeline"
    ):

        with tracer.start_as_current_span(
            "rag.retrieval"
        ):
            candidates = hybrid_search(
                question
            )

        with tracer.start_as_current_span(
            "rag.reranking"
        ):
            reranked = rerank_documents(
                question,
                candidates
            )

        with tracer.start_as_current_span(
            "rag.context"
        ):
            context_documents = (
                reranked[:5]
            )

            context = build_context(
                context_documents
            )

        with tracer.start_as_current_span(
            "rag.llm"
        ):
            answer = generate_answer(
                question,
                context
            )

    return answer
OpenTelemetry automatically maintains the parent-child relationships because each new span is created while its parent span is active.
Choose Meaningful Span Boundaries
When you add distributed tracing to a RAG API, it can be tempting to create a span around every function. That usually produces noisy traces without providing additional diagnostic value.
Prefer spans that represent meaningful operations:
Good:

rag.pipeline
rag.retrieval
rag.reranking
rag.context
rag.llm


Usually unnecessary:

normalize_string
convert_to_numpy
format_document
join_strings
sort_results
A useful span should answer a practical question about the request: where time was spent, which stage failed, or what external operation was performed.
We now have the basic span hierarchy required for distributed tracing in a RAG API. However, these spans currently tell us mainly when each operation started and how long it took. To make RAG traces more useful, the next step is to add RAG-specific attributes such as the number of retrieved documents, context size, search type, reranking results, and LLM information.
Step 3 — Trace Retrieval, Reranking, and LLM Generation
Our trace now shows the main stages of the RAG pipeline, but the spans contain very little information about what happened inside those stages. To add distributed tracing to a RAG API effectively, we should attach a small amount of RAG-specific metadata to each span.
OpenTelemetry calls this metadata span attributes. Attributes make traces searchable and help explain why one request behaved differently from another.
Add Attributes to the Retrieval Span
Instead of creating the retrieval span without a reference, assign it to a variable:
with tracer.start_as_current_span(
    "rag.retrieval"
) as span:

    candidates = hybrid_search(
        question
    )

    span.set_attribute(
        "rag.retrieval.type",
        "hybrid"
    )

    span.set_attribute(
        "rag.retrieval.documents",
        len(candidates)
    )
The trace now tells us not only how long retrieval took, but also which retrieval strategy was used and how many candidates it returned.
rag.retrieval
│
├── duration: 86 ms
├── rag.retrieval.type: hybrid
└── rag.retrieval.documents: 20
This is much more useful when comparing requests. A retrieval span that takes 80 ms and returns 20 candidates represents a different situation from one that takes the same time but returns zero documents.
Trace Hybrid Search Internals
Our RAG system combines BM25 keyword search with FAISS vector search. If we need deeper visibility, we can create child spans for those two operations:
with tracer.start_as_current_span(
    "rag.retrieval"
) as retrieval_span:

    with tracer.start_as_current_span(
        "rag.retrieval.bm25"
    ):
        bm25_results = (
            bm25_search(
                question
            )
        )

    with tracer.start_as_current_span(
        "rag.retrieval.vector"
    ):
        vector_results = (
            vector_search(
                question
            )
        )

    candidates = merge_results(
        bm25_results,
        vector_results
    )

    retrieval_span.set_attribute(
        "rag.retrieval.documents",
        len(candidates)
    )
This creates a more detailed hierarchy:
rag.retrieval
│
├── rag.retrieval.bm25
│
└── rag.retrieval.vector
Now RAG API tracing can reveal whether a retrieval slowdown comes from lexical search, vector search, or another part of the retrieval stage.
However, add this level of detail only when the operations are meaningful enough to investigate independently. If hybrid_search() is already fast and stable, one retrieval span may be sufficient.
Add Reranking Attributes
Reranking usually receives more documents than it returns to the context. Record both values:
with tracer.start_as_current_span(
    "rag.reranking"
) as span:

    span.set_attribute(
        "rag.reranking.input_documents",
        len(candidates)
    )

    reranked = rerank_documents(
        question,
        candidates
    )

    span.set_attribute(
        "rag.reranking.output_documents",
        len(reranked)
    )
The resulting span might contain:
rag.reranking
│
├── duration: 218 ms
├── input_documents: 20
└── output_documents: 20
If your reranking stage reduces the candidate set, the output count can show that behavior directly in the trace.
Trace Context Construction
The context span should describe how much retrieved information is actually passed to the generation layer.
with tracer.start_as_current_span(
    "rag.context"
) as span:

    context_documents = (
        reranked[:5]
    )

    context = build_context(
        context_documents
    )

    span.set_attribute(
        "rag.context.documents",
        len(context_documents)
    )

    span.set_attribute(
        "rag.context.characters",
        len(context)
    )
This gives us a useful distinction between retrieval volume and final context size:
Retrieved candidates: 20
        │
        ▼
Reranked documents: 20
        │
        ▼
Context documents: 5
        │
        ▼
LLM
Context size can affect both LLM latency and token usage, so recording it can help explain why some generation spans are significantly slower or more expensive than others.
Add LLM Span Attributes
The LLM span is one of the most important parts of distributed tracing for a RAG API. We can attach information about the model and its usage without recording the actual prompt.
with tracer.start_as_current_span(
    "rag.llm"
) as span:

    span.set_attribute(
        "rag.llm.model",
        model_name
    )

    answer = generate_answer(
        question,
        context
    )

    span.set_attribute(
        "rag.llm.prompt_tokens",
        prompt_tokens
    )

    span.set_attribute(
        "rag.llm.completion_tokens",
        completion_tokens
    )
The exact way you obtain token usage depends on the LLM client. If generate_answer() currently returns only the generated text, it can return structured generation information instead:
result = generate_answer(
    question,
    context
)

answer = result.answer

span.set_attribute(
    "rag.llm.prompt_tokens",
    result.prompt_tokens
)

span.set_attribute(
    "rag.llm.completion_tokens",
    result.completion_tokens
)
A completed span could then look conceptually like:
rag.llm
│
├── duration: 2.81 s
├── model: model-name
├── prompt_tokens: 2841
└── completion_tokens: 327
Do Not Put Sensitive Content in Span Attributes
The same privacy rules we applied to structured logging also apply when we add distributed tracing to a RAG API. Traces may be exported to an external observability backend and retained for a significant period.
Avoid attributes containing:
user.question
full_prompt
generated_answer
document.text
api_key
authorization_header
Prefer operational metadata:
rag.retrieval.type = "hybrid"
rag.retrieval.documents = 20
rag.context.documents = 5
rag.context.characters = 12480
rag.llm.model = "model-name"
rag.llm.prompt_tokens = 2841
This provides useful diagnostic information without copying user or document content into the tracing system.
Trace an Empty Retrieval Result
Not every unusual RAG request is an application error. Retrieval may complete successfully but return no useful documents.
We can record that condition on the retrieval span:
with tracer.start_as_current_span(
    "rag.retrieval"
) as span:

    candidates = hybrid_search(
        question
    )

    document_count = len(
        candidates
    )

    span.set_attribute(
        "rag.retrieval.documents",
        document_count
    )

    if document_count == 0:
        span.set_attribute(
            "rag.retrieval.empty",
            True
        )
This is preferable to marking every empty retrieval as an OpenTelemetry error. The retrieval operation itself may have executed correctly; it simply found no matching content.
Build the Complete RAG Trace
After adding these attributes, one request can produce a trace similar to:
POST /ask ───────────────────────────── 3.21 s
│
└── rag.pipeline ───────────────────── 3.08 s
    │
    ├── rag.retrieval ── 86 ms
    │   ├── type: hybrid
    │   └── documents: 20
    │
    ├── rag.reranking ───── 218 ms
    │   └── input_documents: 20
    │
    ├── rag.context ─ 12 ms
    │   ├── documents: 5
    │   └── characters: 12480
    │
    └── rag.llm ───────────────── 2.76 s
        ├── model: model-name
        ├── prompt_tokens: 2841
        └── completion_tokens: 327
This is where RAG distributed tracing becomes substantially more useful than a collection of independent timers. We can see the complete execution path, parent-child relationships, stage durations, and the operational state of each stage in one trace.
However, successful requests are only part of production observability. The next step to add distributed tracing to a RAG API is to record exceptions and error status directly on the span where a failure occurs, allowing the trace to show not only where time was spent but exactly where the RAG pipeline failed.
Step 4 — Add Error Information to RAG Traces
A successful trace shows where time was spent. A production trace should also show exactly where a request failed. When we add distributed tracing to a RAG API, OpenTelemetry can record exceptions and mark the corresponding span as an error.
Instead of seeing only:
POST /ask
└── HTTP 500
we want the trace to reveal the failing RAG stage:
POST /ask ───────────────────── ERROR
│
└── rag.pipeline ────────────── ERROR
    │
    ├── rag.retrieval ──────── OK
    ├── rag.reranking ──────── OK
    ├── rag.context ────────── OK
    └── rag.llm ────────────── ERROR
            │
            └── TimeoutError
Record an Exception on a Span
OpenTelemetry spans can record an exception using record_exception(). We can also explicitly set the span status to ERROR.
Import the status classes:
from opentelemetry.trace import (
    Status,
    StatusCode
)
Then update the LLM span:
with tracer.start_as_current_span(
    "rag.llm"
) as span:

    try:
        answer = generate_answer(
            question,
            context
        )

    except Exception as error:

        span.record_exception(
            error
        )

        span.set_status(
            Status(
                StatusCode.ERROR,
                type(error).__name__
            )
        )

        raise
If generation fails, the trace now contains both the failed span and exception information associated with that operation.
The exception is re-raised because tracing should observe application behavior rather than silently change it.
Record Errors at the Stage Where They Occur
Use the same pattern for operations where an exception provides useful diagnostic information.
For example, retrieval:
with tracer.start_as_current_span(
    "rag.retrieval"
) as span:

    try:
        candidates = hybrid_search(
            question
        )

        span.set_attribute(
            "rag.retrieval.documents",
            len(candidates)
        )

    except Exception as error:

        span.record_exception(
            error
        )

        span.set_status(
            Status(
                StatusCode.ERROR,
                type(error).__name__
            )
        )

        raise
A failed vector database call, embedding operation, or search function can therefore appear directly inside the retrieval span rather than only as a generic API failure.
Avoid Recording the Same Exception Everywhere
When you add distributed tracing to a RAG API, it is tempting to record the same exception on the stage span, the parent rag.pipeline span, and the HTTP span.
That usually creates duplicate telemetry.
rag.llm
└── TimeoutError       ← useful


rag.pipeline
└── TimeoutError       ← often duplicate


POST /ask
└── TimeoutError       ← often duplicate
Record detailed exception information where the error actually occurs. Parent spans can still end with an error state as the exception propagates through the instrumented code.
This keeps RAG API tracing easier to read and reduces unnecessary telemetry volume.
Distinguish Errors from Valid RAG Outcomes
Not every undesirable result should be marked as an OpenTelemetry error.
Suppose hybrid retrieval successfully executes but returns zero candidates:
candidates = []

rag.retrieval.empty = true
The search operation itself did not necessarily fail. Marking the span as ERROR would mix application exceptions with valid but potentially low-quality retrieval outcomes.
Instead, keep the span successful and add an attribute:
if not candidates:

    span.set_attribute(
        "rag.retrieval.empty",
        True
    )
This distinction is important:
Search executed successfully
but found nothing
        │
        └── attribute


Search could not execute
        │
        └── ERROR span
The same principle applies to other RAG-specific conditions. Low relevance, an empty context, or a short answer may be signals worth monitoring, but they are not automatically infrastructure errors.
Combine Tracing with Existing Error Logs
Our previous monitoring implementation already records structured errors:
{
  "message": "llm_failed",
  "request_id": "7ad82f19",
  "stage": "llm",
  "error_type": "TimeoutError"
}
We should not remove these logs after introducing OpenTelemetry. Instead, traces and logs provide different views of the same incident.
Trace
│
├── shows execution path
├── identifies failed span
└── shows surrounding latency


Log
│
├── contains operational event
├── searchable by request ID
└── contains application diagnostics
To connect them, include the active trace ID in structured logs.
Create a small helper:
from opentelemetry import trace


def get_trace_id():

    span = trace.get_current_span()

    context = (
        span.get_span_context()
    )

    if not context.is_valid:
        return None

    return format(
        context.trace_id,
        "032x"
    )
Then include it when logging a RAG failure:
logger.exception(
    "llm_failed",
    extra={
        "request_id":
            request_id,
        "trace_id":
            get_trace_id(),
        "stage": "llm",
        "error_type":
            type(error).__name__
    }
)
Add trace_id to the optional fields handled by our JSON formatter:
fields = [
    "request_id",
    "trace_id",
    "endpoint",
    "status_code",
    "stage",
    "duration_ms",
    "documents_retrieved",
    "documents_in_context",
    "prompt_tokens",
    "completion_tokens",
    "total_tokens",
    "error_type"
]
Now an engineer investigating an error can move from a log entry directly to the corresponding distributed trace.
Keep Sensitive Error Data Out of Traces
Exception messages can sometimes contain request data, URLs, provider responses, or other information that should not be retained in an observability system.
This is particularly important when you add distributed tracing to a RAG API that processes private documents.
Do not deliberately add sensitive values as error attributes:
span.set_attribute(
    "error.prompt",
    full_prompt
)

span.set_attribute(
    "error.document",
    document_text
)
Prefer controlled operational attributes such as:
rag.stage = "llm"
rag.llm.model = "model-name"
rag.context.documents = 5
Exception recording, structured logs, and trace IDs now give us a complete path from a failed API request to the exact RAG operation responsible for the failure.
At this point, we can generate useful traces inside the application. The next step to add distributed tracing to a RAG API is to export those traces to a tracing backend where we can search requests, inspect span timelines, and analyze the complete RAG execution path visually.
Step 5 — Export and View RAG Traces
So far, OpenTelemetry creates spans inside the FastAPI application, but traces become much more useful when they are exported to a tracing backend. The next step to add distributed tracing to a RAG API is to send those spans through OTLP and inspect the complete RAG request visually.
The architecture becomes:
FastAPI RAG API
      │
      ▼
OpenTelemetry SDK
      │
      ▼
OTLP Exporter
      │
      ▼
Tracing Backend
      │
      ▼
Trace Search + Timeline
OTLP is the OpenTelemetry Protocol used to transfer telemetry between applications, collectors, and compatible observability systems.
Use the OTLP Exporter
We already created an OTLP exporter in tracing.py:
from opentelemetry.exporter.otlp.proto.grpc.trace_exporter import (
    OTLPSpanExporter
)


exporter = OTLPSpanExporter(
    endpoint=
        "http://localhost:4317",
    insecure=True
)
For a real deployment, keep the endpoint in an environment variable:
OTEL_EXPORTER_OTLP_ENDPOINT=
http://localhost:4317
Then read it in Python:
import os


endpoint = os.getenv(
    "OTEL_EXPORTER_OTLP_ENDPOINT",
    "http://localhost:4317"
)

exporter = OTLPSpanExporter(
    endpoint=endpoint,
    insecure=True
)
This lets the same application send traces to different destinations without changing the RAG API code.
Send Traces Through an OpenTelemetry Collector
For local experiments, an application can sometimes export directly to a tracing backend. In production, a common architecture places an OpenTelemetry Collector between the application and the backend.
RAG API
   │
   │ OTLP
   ▼
OpenTelemetry Collector
   │
   ▼
Tracing Backend
The collector separates telemetry processing from the application. The RAG API only needs to know where to send OTLP data, while the collector can handle routing, batching, filtering, and exporting.
This is useful when you add distributed tracing to a RAG API because the tracing backend can later change without requiring the RAG pipeline itself to be redesigned.
Configure the Collector
A minimal collector configuration can receive OTLP traces over gRPC:
receivers:
  otlp:
    protocols:
      grpc:

processors:
  batch:

exporters:
  debug:
    verbosity: basic

service:
  pipelines:
    traces:
      receivers:
        - otlp
      processors:
        - batch
      exporters:
        - debug
This configuration is useful during development because the collector receives spans and writes trace information through its debug exporter.
Later, the debug exporter can be replaced or supplemented with an exporter supported by the tracing backend used in your environment.
Point the RAG API to the Collector
If FastAPI and the collector run in separate Docker containers on the same network, localhost inside the API container refers to the API container itself, not the collector.
Instead, use the collector service name:
OTEL_EXPORTER_OTLP_ENDPOINT=
http://otel-collector:4317
The resulting container communication becomes:
rag-api:8000
     │
     │ OTLP
     ▼
otel-collector:4317
     │
     ▼
Tracing Backend
This is the same networking principle we used when connecting Prometheus to the RAG API.
Inspect a RAG Trace
After sending a request to /ask, the tracing backend should display one trace containing the HTTP request and our custom RAG spans.
Conceptually, the timeline may look like:
POST /ask
│██████████████████████████████│ 3210 ms
│
└─ rag.pipeline
  │████████████████████████████│ 3078 ms
  │
  ├─ rag.retrieval
  │██│ 86 ms
  │
  ├─ rag.reranking
  │████│ 218 ms
  │
  ├─ rag.context
  │█│ 12 ms
  │
  └─ rag.llm
    │███████████████████████│ 2760 ms
The visualization immediately shows that LLM generation dominates the request latency. If another request has slow retrieval instead, its timeline will look different.
Inspect Span Attributes
Selecting a span should reveal the attributes we added earlier.
For retrieval:
span.name:
rag.retrieval

rag.retrieval.type:
hybrid

rag.retrieval.documents:
20
For the LLM:
span.name:
rag.llm

rag.llm.model:
model-name

rag.llm.prompt_tokens:
2841

rag.llm.completion_tokens:
327
These attributes turn RAG distributed tracing into more than a latency visualization. They provide operational context that helps explain what happened during each request.
Search for Failed Traces
If the LLM stage raises an exception, the trace can show the failed span:
POST /ask ───────────────── ERROR
│
└── rag.pipeline ────────── ERROR
    │
    ├── rag.retrieval ───── OK
    ├── rag.reranking ───── OK
    ├── rag.context ─────── OK
    │
    └── rag.llm ─────────── ERROR
            │
            └── TimeoutError
Instead of starting with a generic HTTP 500 response and manually reconstructing the execution path from logs, the trace immediately identifies the stage where execution stopped.
The trace_id can then be used to find the corresponding structured logs for additional application-level information.
Keep the Export Path Outside the RAG Logic
The RAG functions should not know whether traces are ultimately stored in a particular tracing product or observability platform.
Keep the responsibilities separated:
rag.py
│
└── creates meaningful spans


tracing.py
│
└── configures OpenTelemetry


OTLP
│
└── transports traces


Collector / Backend
│
└── processes and stores traces
This separation is one of the main advantages of using OpenTelemetry to add distributed tracing to a RAG API. The application produces standardized telemetry while the infrastructure determines where that telemetry is processed and stored.
For the OpenTelemetry architecture, SDKs, collectors, and supported signals, see the official OpenTelemetry documentation.
We now have the complete trace path from FastAPI through retrieval, reranking, context construction, and LLM generation to an external tracing system. The next step is to test the implementation and verify that parent-child relationships, attributes, errors, and trace-to-log correlation work correctly.
Step 6 — Test Distributed Tracing
After we add distributed tracing to a RAG API, we should verify more than whether traces simply appear in the backend. A correct trace should preserve the span hierarchy, contain useful RAG attributes, identify errors, and connect back to our structured logs.
Start the Tracing Infrastructure
First, make sure the OpenTelemetry Collector or another OTLP-compatible receiver is running and that the RAG API points to the correct endpoint:
OTEL_EXPORTER_OTLP_ENDPOINT=
http://otel-collector:4317
Then start the RAG API. If you are using Docker:
docker run \
  -d \
  --name rag-api \
  -p 8000:8000 \
  --env-file .env \
  rag-assistant:1.4.0
Check the application logs to make sure there are no exporter or connection errors:
docker logs -f rag-apiSend a Successful RAG Request
Call the existing /ask endpoint:
curl \
  -i \
  -X POST \
  http://localhost:8000/ask \
  -H "Content-Type: application/json" \
  -H "X-API-Key: development-secret" \
  -d '{
    "question":
      "How does hybrid search improve RAG?"
  }'
The API should return a normal response. Distributed tracing should not change the endpoint behavior.
Now open the tracing backend and locate the request. A successful RAG API trace should have approximately this hierarchy:
POST /ask
│
└── rag.pipeline
    │
    ├── rag.retrieval
    │
    ├── rag.reranking
    │
    ├── rag.context
    │
    └── rag.llm
If hybrid search was instrumented more deeply, retrieval may also contain:
rag.retrieval
│
├── rag.retrieval.bm25
└── rag.retrieval.vector
Verify Span Durations
Check that each span has its own duration and that child spans fit within their parent span.
POST /ask                 3184 ms
│
└── rag.pipeline          3052 ms
    │
    ├── retrieval           91 ms
    ├── reranking          224 ms
    ├── context             10 ms
    └── llm               2701 ms
The exact values will vary between requests. What matters is that the timeline represents the actual execution sequence and makes the major RAG latency contributors visible.
Verify RAG Span Attributes
Select the retrieval span and check that the expected operational attributes are present:
rag.retrieval.type = "hybrid"
rag.retrieval.documents = 20
Then inspect the context and LLM spans:
rag.context.documents = 5
rag.context.characters = 12480

rag.llm.model = "model-name"
rag.llm.prompt_tokens = 2841
rag.llm.completion_tokens = 327
The trace should contain enough information to understand the RAG request without storing the complete question, prompt, answer, or retrieved document text.
Verify Trace and Log Correlation
Next, find the trace_id in the structured application logs:
{
  "message": "llm_completed",
  "request_id": "7ad82f19",
  "trace_id": "4bf92f3577b34da6...",
  "stage": "llm",
  "duration_ms": 2701.4
}
Search for that same trace ID in the tracing backend. It should identify the trace generated by the same request.
Application Log
      │
      │ trace_id
      ▼
Distributed Trace
      │
      └── POST /ask
            └── rag.pipeline
                  └── rag.llm
This correlation is one of the main reasons to add distributed tracing to a RAG API that already uses structured logging.
Test an Error Trace
During development, temporarily raise an exception inside one RAG stage:
with tracer.start_as_current_span(
    "rag.llm"
) as span:

    raise RuntimeError(
        "Test tracing failure"
    )
Send another request to /ask. The resulting trace should identify rag.llm as the failed operation and contain the exception event.
POST /ask ─────────────── ERROR
│
└── rag.pipeline
    │
    ├── rag.retrieval ─── OK
    ├── rag.reranking ─── OK
    ├── rag.context ───── OK
    │
    └── rag.llm ───────── ERROR
            │
            └── RuntimeError
The corresponding structured log should contain the same trace ID, allowing you to move from the visual trace to the application error details.
Remove the artificial exception after completing the test.
Verify That Tracing Does Not Expose Content
Finally, inspect several traces and confirm that they do not contain:
API keys
authorization headers
full user questions
complete prompts
retrieved document text
generated answers
This check is especially important before enabling distributed tracing in a production RAG system.
At this point, we have verified the complete tracing path:
Client Request
      │
      ▼
FastAPI Span
      │
      ▼
RAG Pipeline Span
      │
      ├── Retrieval
      ├── Reranking
      ├── Context
      └── LLM
      │
      ▼
OTLP
      │
      ▼
Trace Backend
      │
      └── correlated with logs
The implementation to add distributed tracing to a RAG API is now working end to end. Before using it under real production traffic, however, we should consider sampling, telemetry volume, security, performance overhead, and multi-service trace propagation.
Production Tracing Considerations
The tracing implementation now works end to end, but production traffic introduces additional concerns. When you add distributed tracing to a RAG API, every request can generate several spans, attributes, and exception events. At scale, that means additional telemetry volume, storage requirements, network traffic, and processing overhead.
Use Trace Sampling
During development, recording every request is convenient. In production, storing 100% of traces may be unnecessary, especially for a high-traffic RAG API.
1,000 API requests
        │
        ├── 1,000 HTTP spans
        ├── 1,000 pipeline spans
        ├── 1,000 retrieval spans
        ├── 1,000 reranking spans
        ├── 1,000 context spans
        └── 1,000 LLM spans

        = 6,000+ spans
Sampling allows only a percentage of traces to be recorded and exported.
For example, configure a parent-based ratio sampler:
from opentelemetry.sdk.trace.sampling import (
    ParentBased,
    TraceIdRatioBased
)


sampler = ParentBased(
    TraceIdRatioBased(
        0.1
    )
)

provider = TracerProvider(
    resource=resource,
    sampler=sampler
)
A ratio of 0.1 samples approximately 10% of new traces. The appropriate value depends on traffic volume, debugging requirements, storage capacity, and the tracing backend.
Parent-based sampling also helps preserve a consistent tracing decision as requests move between instrumented services.
Keep Span Attributes Controlled
As with Prometheus labels, avoid turning arbitrary user input into tracing metadata.
Good RAG span attributes are small and operational:
rag.retrieval.type
rag.retrieval.documents
rag.context.documents
rag.llm.model
rag.llm.prompt_tokens
rag.llm.completion_tokens
Avoid large or sensitive attributes:
rag.question
rag.prompt
rag.answer
rag.document_text
user.api_key
This reduces telemetry size and prevents private RAG content from being unnecessarily copied into the observability infrastructure.
Propagate Trace Context Between Services
Distributed tracing becomes particularly valuable when the RAG architecture is divided into several services.
FastAPI RAG API
      │
      ▼
Retrieval Service
      │
      ▼
Vector Database
      │
      ▼
Model Gateway
      │
      ▼
LLM Provider
For one trace to follow this complete path, trace context must propagate between services. OpenTelemetry instrumentation can inject trace information into outgoing requests and extract it when another instrumented service receives them.
Without context propagation, each service may generate a separate trace:
Trace A
FastAPI


Trace B
Retrieval Service


Trace C
Model Service
With propagation, the operations can belong to the same distributed trace:
Trace A
│
├── FastAPI
│
├── Retrieval Service
│
├── Vector Search
│
└── Model Service
This is the key difference between simply creating spans and implementing true distributed tracing for a RAG API.
Consider Tracing Overhead
Tracing is additional application work. Creating spans, adding attributes, processing them, and exporting telemetry all consume resources.
The BatchSpanProcessor used earlier helps because spans are exported asynchronously in batches rather than synchronously during each RAG operation.
Request
   │
   ├── create spans
   │
   ▼
Response


Completed spans
   │
   ▼
BatchSpanProcessor
   │
   ▼
OTLP Exporter
Keep instrumentation focused on meaningful operations rather than creating spans around every small Python function. This improves trace readability while limiting overhead.
Use Environment-Specific Configuration
Tracing configuration should normally come from environment variables or deployment configuration rather than application constants.
OTEL_EXPORTER_OTLP_ENDPOINT=
http://otel-collector:4317

OTEL_SERVICE_NAME=
rag-assistant-api
Development, staging, and production environments can then use different collectors, sampling policies, and tracing backends without modifying the RAG implementation.
Plan for Collector Failures
Observability infrastructure should not become a critical dependency for answering RAG requests.
Tracing Backend unavailable
          │
          ▼
Collector problem
          │
          ▼
RAG API should continue serving requests
The primary purpose of tracing is observation. A temporary telemetry outage should not normally prevent retrieval or LLM generation from functioning.
Protect the Entire Telemetry Pipeline
When you add distributed tracing to a RAG API, traces leave the application and may pass through a collector before reaching persistent storage.
RAG API
   │
   ▼
OTLP
   │
   ▼
Collector
   │
   ▼
Trace Storage
Production deployments should therefore consider authentication, encrypted transport, access control, data retention, and network isolation for the complete tracing path.
With these safeguards, distributed tracing can scale from a development debugging tool into a useful production observability layer. The final piece is understanding how traces fit together with the structured logs and Prometheus metrics we already added to the RAG API.
Logs, Metrics, and Traces: How They Work Together
After we add distributed tracing to a RAG API, our application has three complementary observability signals: structured logs, Prometheus metrics, and OpenTelemetry traces. They overlap in some areas, but each answers a different type of question.
                  RAG API
                     │
          ┌──────────┼──────────┐
          │          │          │
          ▼          ▼          ▼
        Logs       Metrics    Traces
          │          │          │
          ▼          ▼          ▼
       Events      Trends    Execution
                              Paths
Logs Explain Individual Events
Structured logs are useful when we need detailed information about something that happened inside the application.
{
  "message": "llm_failed",
  "request_id": "7ad82f19",
  "trace_id": "4bf92f3577b34da6...",
  "stage": "llm",
  "error_type": "TimeoutError"
}
A log can tell us which stage failed, which request was affected, and what type of application error occurred.
Logs are therefore particularly useful for debugging individual events and investigating known failures.
Metrics Show Trends
Prometheus metrics answer questions about the RAG service as a whole:
How many requests are arriving?

Is the error rate increasing?

Is LLM latency getting worse?

Are 429 responses increasing?

How many tokens are being used?
Metrics aggregate many requests, making them suitable for dashboards, long-term performance analysis, and alerts.
For example:
rag_errors_total{
  stage="llm"
} 27

rag_http_requests_total{
  status_code="500"
} 31
These values tell us that something may be wrong, but they do not explain the execution path of a particular failed request.
Traces Explain the Request Path
Distributed traces connect operations into a timeline:
POST /ask
│
└── rag.pipeline
    │
    ├── retrieval ─── 91 ms
    ├── reranking ─── 224 ms
    ├── context ───── 10 ms
    │
    └── llm ───────── 2701 ms
                      ERROR
This tells us where time was spent and where execution failed. That is the main additional capability we gain when we add distributed tracing to a RAG API.
Use the Three Signals Together
Consider a production incident where users report slow responses.
Prometheus may first reveal the trend:
LLM latency
   │
   │        ╭──────
   │      ╭─╯
   │  ────╯
   └────────────────► time
We can then inspect slow traces and discover:
retrieval     85 ms
reranking    210 ms
context       11 ms
LLM         6900 ms
The trace shows that the LLM stage is responsible for most of the increased latency.
Finally, the trace ID can locate related structured logs:
Metric Alert
     │
     ▼
Slow RAG Requests
     │
     ▼
Distributed Trace
     │
     ├── identifies slow stage
     │
     ▼
Trace ID
     │
     ▼
Structured Logs
     │
     └── detailed application events
The same workflow applies to errors. Metrics reveal that the error rate changed, traces identify the failing RAG operation, and logs provide detailed application diagnostics.
Do Not Force Every Signal to Store the Same Data
A common observability mistake is trying to put identical information into logs, metrics, and traces.
Instead, use each signal for what it does best:
LOGS
request_id
trace_id
error_type
application events


METRICS
request count
error rate
latency distributions
token usage


TRACES
parent-child relationships
stage duration
execution path
span attributes
exceptions
For example, a unique request_id belongs naturally in logs but should not become a Prometheus label. A retrieval document count may be useful as a metric and a span attribute, while the complete retrieved document text belongs in neither by default.
The Complete RAG Observability Architecture
After adding logging, monitoring, and distributed tracing to a RAG API, our production architecture now looks like:
                     Client
                       │
                       ▼
                 FastAPI /ask
                       │
                       ▼
                  RAG Pipeline
                       │
          ┌────────────┼────────────┐
          │            │            │
          ▼            ▼            ▼
     JSON Logs     Prometheus   OpenTelemetry
          │          Metrics       Traces
          │            │            │
          ▼            ▼            ▼
     Log Storage   Prometheus    Collector
                                    │
                                    ▼
                              Trace Backend
These layers do not improve retrieval relevance or answer quality directly. Instead, they make the production system observable: we can detect changes, locate bottlenecks, follow individual requests, and investigate failures without guessing which part of the RAG pipeline caused the problem.
With the observability stack complete, we can connect this tutorial to the other production and RAG quality components built throughout the series.
Where to Go Next
We now have a production-oriented observability stack around the RAG assistant. By learning how to add distributed tracing to a RAG API, we extended the existing logging and monitoring architecture with a detailed view of how individual requests move through retrieval, reranking, context construction, and LLM generation.
If you are following the complete RAG tutorial series, these articles cover the components that surround the tracing layer:
- Add Logging and Monitoring to a RAG API — add structured logs, request IDs, latency measurements, and Prometheus metrics.
- Add Authentication and Rate Limiting to a RAG API — protect the API and control request volume.
- Dockerize a RAG Assistant with FastAPI — package the RAG application for consistent deployment.
- Deploy a RAG Assistant with FastAPI — expose the RAG pipeline through a production-oriented API.
- Evaluate a RAG System in Python — measure retrieval and answer quality separately from operational performance.
- Build Reranking for RAG in Python — improve the relevance of documents selected for the LLM.
These components solve different parts of the production RAG problem:
RAG Quality
│
├── Retrieval
├── Reranking
└── Evaluation


RAG API
│
├── FastAPI
├── Authentication
└── Rate Limiting


Deployment
│
└── Docker


Observability
│
├── Structured Logging
├── Prometheus Metrics
└── OpenTelemetry Tracing
Together, they turn a basic retrieval and generation pipeline into a system that can be deployed, protected, measured, traced, and systematically improved.
Frequently Asked Questions
What is distributed tracing in a RAG API?
Distributed tracing records how a request moves through the different operations and services involved in a RAG pipeline. A trace can contain spans for the FastAPI request, retrieval, reranking, context construction, LLM generation, and external services.
When you add distributed tracing to a RAG API, these operations become part of the same execution timeline instead of appearing as unrelated events.
What is a span in OpenTelemetry?
A span represents one operation inside a trace. It records when the operation starts, how long it takes, its relationship to other spans, and optional attributes or error information.
For a RAG system, useful spans include:
rag.pipeline
rag.retrieval
rag.reranking
rag.context
rag.llm
What is the difference between a trace ID and a request ID?
A request ID is an application-level identifier commonly used to correlate log entries. A trace ID is part of the distributed tracing context and identifies the complete trace across instrumented operations and potentially multiple services.
Both can be useful. The request ID remains convenient for application logging, while the trace ID connects logs with OpenTelemetry traces.
Does OpenTelemetry replace structured logging?
No. Distributed tracing and structured logging solve related but different problems. Traces show the execution path and parent-child relationships between operations. Logs provide detailed records of application events.
A production RAG API can use both and include the OpenTelemetry trace_id in structured logs to connect the two.
Does OpenTelemetry replace Prometheus?
No. Prometheus metrics are well suited to monitoring aggregated behavior such as request rates, error rates, and latency distributions. Traces are better suited to investigating the execution path of individual requests.
Using logs, metrics, and traces together provides a more complete observability system.
What should I trace in a RAG pipeline?
Trace operations that represent meaningful boundaries in the pipeline. Retrieval, reranking, context building, and LLM generation are good starting points. Hybrid retrieval may also contain separate BM25 and vector search spans when those operations need to be analyzed independently.
Avoid creating spans around every small helper function because excessive instrumentation makes traces harder to understand and increases telemetry volume.
Should prompts and retrieved documents be stored in traces?
Generally, no. Prompts, user questions, generated answers, and retrieved document text may contain sensitive or private information. Operational attributes such as document counts, model names, context size, and token usage are usually safer and more useful for production RAG API tracing.
How does distributed tracing help diagnose slow RAG requests?
A trace shows the duration of each stage in the same timeline. For example, it can reveal whether a slow request spent most of its time in vector retrieval, reranking, context construction, or LLM generation.
retrieval      90 ms
reranking     220 ms
context        12 ms
LLM          4800 ms
In this example, the trace immediately shows that LLM generation dominates request latency.
Should every RAG request be traced?
Not necessarily. Recording every trace can create substantial telemetry volume in high-traffic applications. Production systems often use sampling so that only a percentage of requests are stored while still providing enough traces for performance analysis and debugging.
What is the OpenTelemetry Collector?
The OpenTelemetry Collector is a separate component that can receive telemetry from applications, process it, and export it to one or more observability backends.
RAG API
   │
   ▼
OpenTelemetry Collector
   │
   ▼
Tracing Backend
Using a collector keeps telemetry routing and processing outside the RAG application itself.
Is adding spans enough for distributed tracing?
It is enough when all relevant operations run inside the same application process. When the RAG architecture uses multiple services, trace context must also propagate between those services.
That context propagation allows retrieval services, model gateways, and other instrumented components to participate in the same trace. This is what makes it possible to add distributed tracing to a RAG API across a genuinely distributed architecture.
Conclusion
As a RAG system moves from a prototype to production, knowing that an API request failed or became slow is not enough. We also need to understand what happened inside the request and which part of the pipeline was responsible.
In this tutorial, we learned how to add distributed tracing to a RAG API with FastAPI and OpenTelemetry. We instrumented incoming HTTP requests, created custom spans for the RAG pipeline, and traced retrieval, reranking, context construction, and LLM generation.
We also added RAG-specific span attributes, recorded exceptions, connected traces with structured logs, exported telemetry through OTLP, and discussed sampling and trace propagation for production environments.
Client
  │
  ▼
FastAPI
  │
  ▼
rag.pipeline
  │
  ├── rag.retrieval
  ├── rag.reranking
  ├── rag.context
  └── rag.llm
        │
        ▼
   OpenTelemetry
        │
        ▼
      OTLP
        │
        ▼
  Trace Backend
Distributed tracing completes the observability architecture we started with structured logging and Prometheus monitoring. Metrics show when system behavior changes, traces reveal where the problem occurs, and logs provide detailed application events for investigation.
With these components working together, the RAG API is no longer a black box. We can follow individual requests through the pipeline, identify latency bottlenecks, locate failures, and understand how retrieval and generation behave under production traffic.
Learning how to add distributed tracing to a RAG API therefore provides an important foundation for operating larger RAG systems, especially as retrieval, vector search, model access, and other components move into separate services.